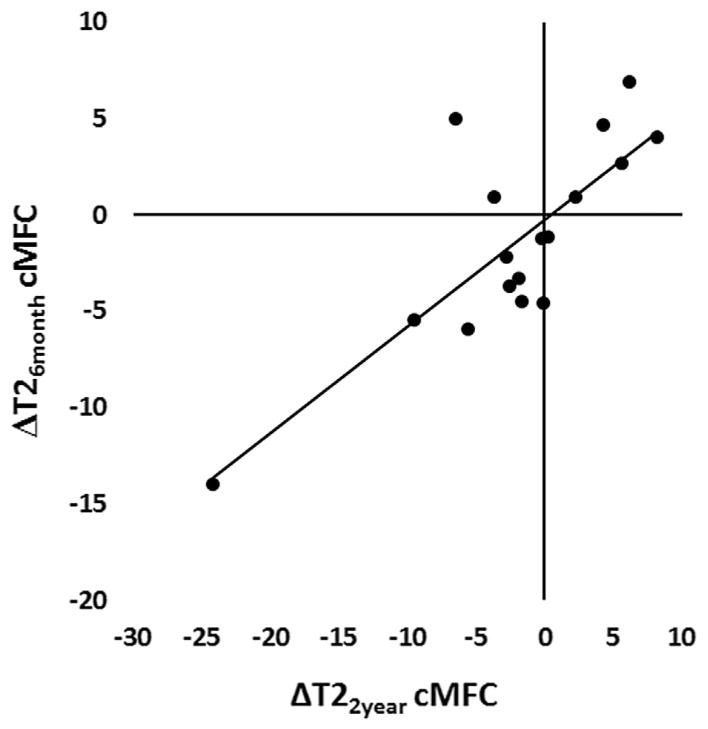
Figure 2.
Short-term mean T2 change correlates to 2-year mean T2 change. Change of mean T2 over 6 months in cMFC cartilage demonstrated correlations with change in mean T2 over 2 years in the same region (n = 17; Pearson correlation R = 0.80; p = 0.0001). Solid line indicates linear fit. The correlation remains significant with exclusion of the outlier (n = 16, Pearson R = 0.62, p = 0.009).

