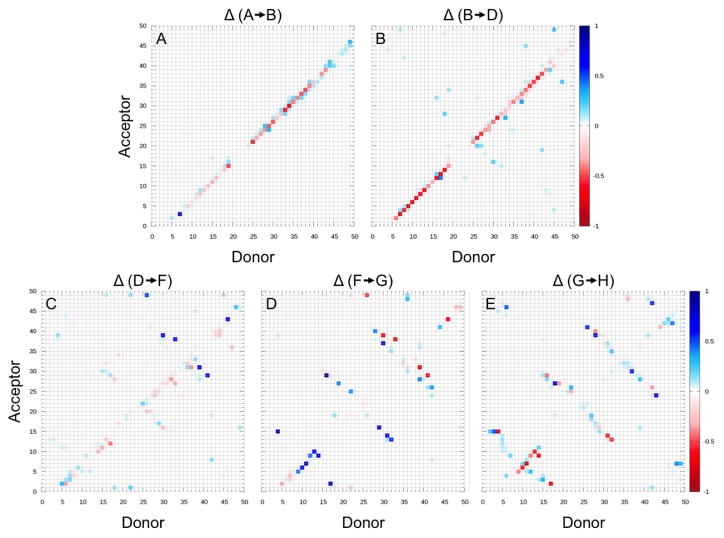
Figure 4.
Percentage of structures that gained (blue) or lost (red) backbone hydrogen bonds between the residues indicated on x and y axis, when converting from one region of the free energy landscape to another. The involved regions are indicated at the top of each panel, with the indices corresponding to the ones defined in Figure 3.

