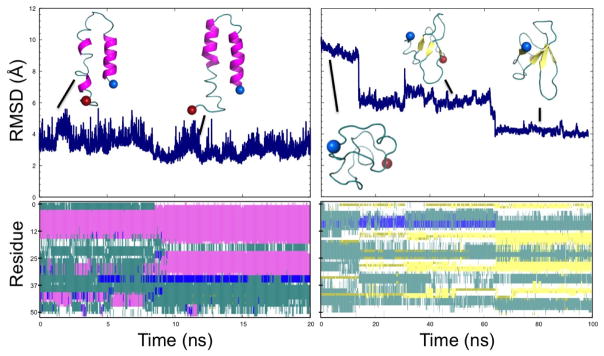
Figure 5.
Formation of the helix hairpin (left panels) and the β-barrel (right panels). Top panels show the root-mean-square-deviation (RMSD) to the helix hairpin (left) and the β-barrel (right). Configurations from various time points are shown. Secondary structure analysis by the VMD program41 is shown in the bottom panel. Here, pink represents &agr; helices and yellow β-sheets.

