Figure 8.
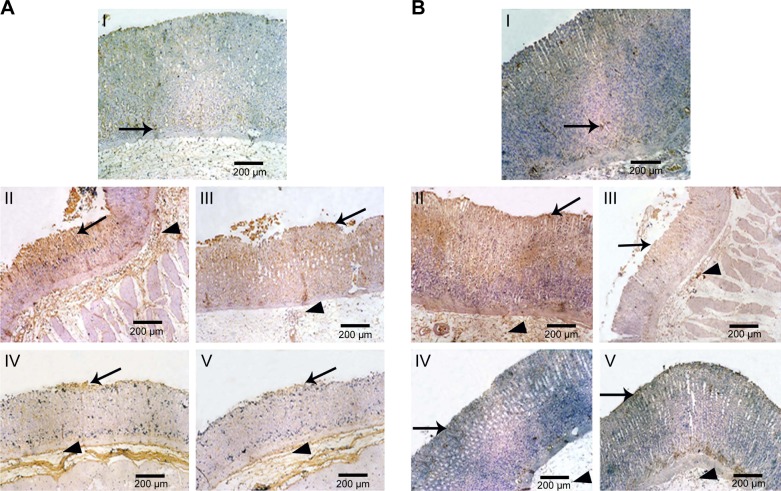
Microphotographs of gastric tissue of rats using immunohistochemical staining for (A) TNF-α and (B) caspase-3 in comparison with normal and positive control groups (IHC, 100×).
Notes: (I) Normal control displaying minimal brown-stained gastric mucosal epithelium (arrow), (II) positive control showing intense brown staining in gastric mucosal epithelium (arrow), gastric glands, and submucosa (arrow head), (III) rats orally pretreated with naringin (100 mg/kg) showing moderate brown staining of the gastric mucosal epithelium (arrow), gastric glands, and submucosa (arrow head), and orally pretreated with either (IV) naringin (200 mg/kg) or (V) naringin–PF68 micelles (100 mg/kg) displaying mild brown staining of superficial gastric mucosal epithelium (arrow) and gastric glands and submucosa (arrow head).
Abbreviations: IHC, immunohistochemical; PF68, pluronic F68; TNF-α, tumor necrosis factor-alpha.

