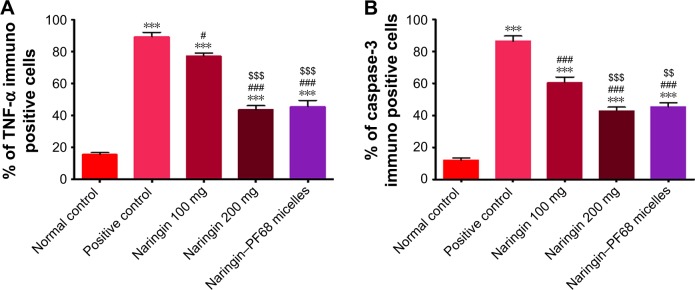
Figure 9.
Effects of naringin oral pretreatment on ethanol-induced increase of gastric expression of TNF-α and caspase-3 in rats in comparison with normal and positive control groups (IHC, 100×).
Notes: (A) TNF-α and (B) caspase-3. Data are mean ± SD, n=6. ***P<0.001 vs normal control group. #P<0.05 and ###P<0.001 vs positive control group. $$P<0.01, and $$$P<0.001 vs 100 mg/kg naringin pretreated group.
Abbreviations: IHC, immunohistochemical; PF68, pluronic F68; TNF-α, tumor necrosis factor-alpha.

