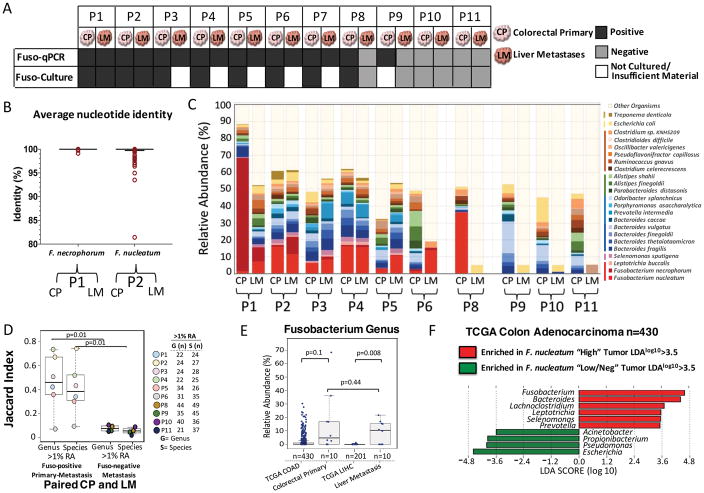
Fig. 1. Fusobacterium colonizes liver metastases of Fusobacterium associated colorectal primary tumors.
(A) Schematic of Fusobacterium culture and Fusobacterium-targeted qPCR status of paired snap-frozen colorectal primary tumors and liver metastases from 11 patients (P1 to P11) from the frozen paired cohort. (B) Aligned dot plot representing the average nucleotide identity (ANI) of whole-genome sequencing data from F. necrophorum isolated from paired primary colorectal tumor (CP) and liver metastasis (LM) of P1 and F. nucleatum isolate cultured from paired primary tumors and liver metastasis of P2. F. necrophorum P1 two-way ANI: 100% (SD: 0.01%) from 10,220 fragments; F. nucleatum P2 two-way ANI: 99.99% (SD: 0.23%) from 7334 fragments. (C) Species-level microbial composition of paired colorectal primary tumors and liver metastases (frozen paired cohort), assayed by RNA sequencing followed by PathSeq analysis for microbial identification. For simplicity, only organisms with >2% relative abundance (RA) in at least one tumor are shown. The colors correspond to bacterial taxonomic class. Red, Fusobacteriia; pink, Negativicutes; blue/green, Bacteroidia; orange, Clostridia; yellow, Gamma-proteobacteria; dark brown, Spirochaetes. The samples are separated into three groups: Fusobacterium-positive primary tumor and metastases (n = 6 pairs), Fusobacterium-positive primary tumor and Fusobacterium-negative metastases (n = 1 pair), and Fusobacterium-negative primary tumor and metastases (n = 3 pairs). P7 had insufficient tissue for RNA sequencing analysis. (D) Box plots represent the Jaccard index (proportion of shared genera or species) between paired colorectal primary tumors and liver metastases at both the genus and species level at 1% RA. The box represents the first and third quartiles, and error bars indicate the 95% confidence level of the median. Paired samples that were positive for Fusobacterium in both the primary tumor and metastasis were compared with paired samples where the metastasis was Fusobacterium-negative. P values were determined using Welch’s two-sample t test. (E) Box plots of Fusobacterium RA in primary colon adenocarcinoma (COAD) (n = 430) and primary liver hepatocellular carcinoma (LIHC) (n = 201) from TCGA (TCGA cohort) and primary-metastasis pairs from 10 patients. The box represents the first and third quartiles, and error bars indicate the 95% confidence level of the median. P values were determined using Welch’s two-sample t test with correction for unequal variances. (F) Identification of bacteria that co-occur with Fusobacterium in primary COAD (TCGA cohort). Primary COAD tumors were subset into two groups: Fusobacterium “High” if Fusobacterium RA was >1% (n = 110, median RA = 5%, mean RA = 7.4%) and Fusobacterium “Low/Neg” if RA was <1% (n = 320, median RA = 0.06%, mean RA = 0.16%). The bar plot illustrates genera enriched (red) and depleted (green) in COAD with >1% Fusobacterium RA. LDA, linear discriminant analysis.

