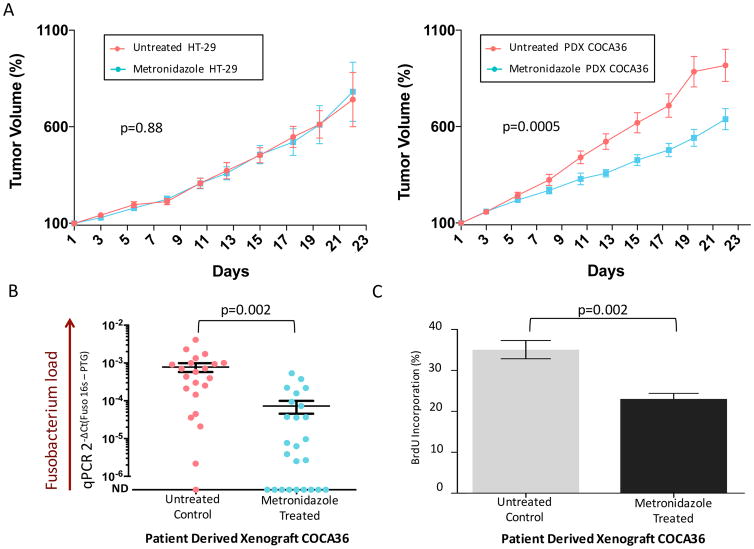
Fig. 4. Treatment of Fusobacterium-colonized PDXs with metronidazole reduces tumor growth in vivo.
(A) (Left) Tumor volume percentage of Fusobacterium-free xenografts derived from HT-29 cells treated with metronidazole (treated; 19 animals) or with vehicle (untreated; 20 animals). (Right) Tumor volume percentage of Fusobacterium-positive PDX tumors (COCA36) treated with metronidazole (treated; 25 animals) or with vehicle (untreated; 22 animals). P values were determined by the Wald test. Tumors were measured in a blinded fashion on Mondays, Wednesdays, and Fridays each week. Error bars represent mean ± SEM. The remaining number of HT-29-derived xenografts and PDX-implanted animals at each time point is included in the supplementary materials. (B) Assessment of Fusobacterium tissue load. Fusobacterium-targeted qPCR on PDX tissue (COCA36) after treatment with metronidazole (treated) or with vehicle (untreated). ND, not detected. The center bar represents the mean; error bars indicate SEM. P values were determined using Welch’s two-sample t test. DCt, delta cycle threshold; PTG, prostaglandin transporter. (C) Bromodeoxyuridine (BrdU) immunohistochemistry of PDX tumors to assess cell proliferation. The bar plot represents the percentage of cells with BrdU incorporation in treated and untreated PDXs (n = 6 animals). per arm); error bars denote mean ± SEM. P values were determined using the Welch’s two-sample t test.

