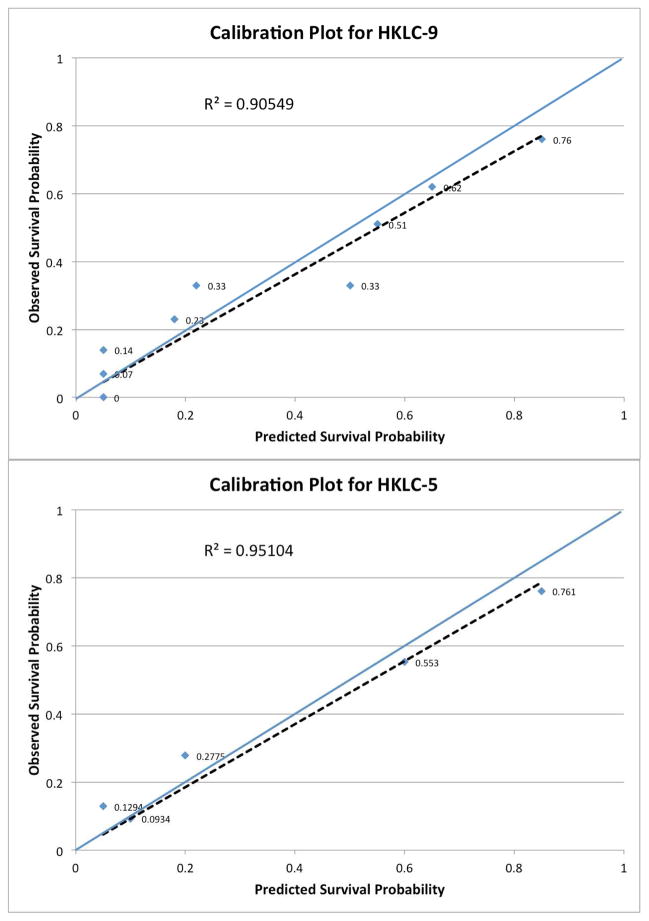
Figure 3. Calibration plots for HKLC-5 and HKLC-9.
Calibration plots for HKLC-9 (A) and for HKLC-5 (B). They plot the validation cohort patients’ actual survival time (y-axis) versus the HKLC staging system’s predicted survival (x-axis). The closer points are to the reference line (blue), the better the calibration. The dotted line represents the least-squares trendline. Both HKLC-9 and HKLC-5 demonstrate moderate to good calibration with R2 = 0.9055 and R2 = 0.9510, respectively.

