Figure 3.

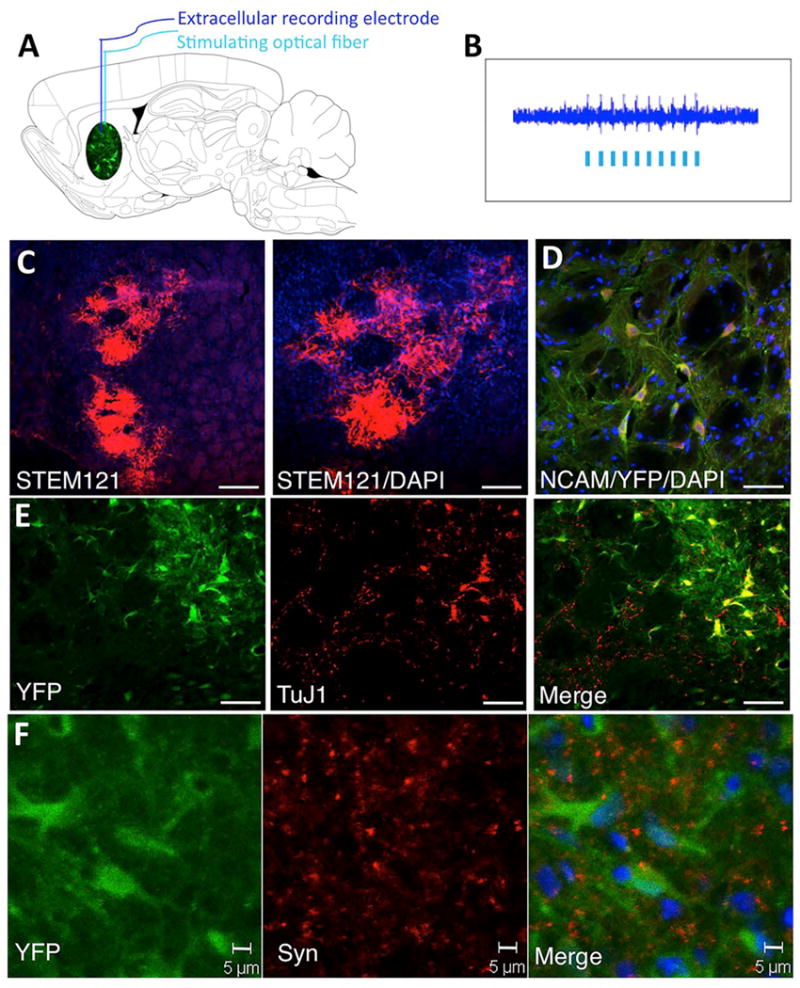
In vivo optical stimulation recording and characterization of NSC grafts. (A) Schematic drawing of a sagittal section through the rat brain illustrating the simultaneous in vivo optical stimulation and recording from the NSC grafts. Both the stimulating fiber optic (200 μm) and the extracellular tungsten recording electrode (1 MOhm, ~125 μm) were inserted through the guiding cannula used for chronic stimulation. (B) Electrophysiological recording of the extracellular activity driven by the optogenetic stimulation. (C) Low magnification microphotos taken from frontal sections through the graft in the striatum showing grafted NSCs expressing the human marker STEM121. (D) ChR2-expressing grafted cells identified by the expression of YFP (green) coexpress the neural marker NCAM. (E) Grafted cells expressing ChR2 (YFP, green) coexpress the neuronal marker TuJ1. (F) Grafted cells expressing ChR2 (YFP, green) appear decorated by synaptophysin+ in synaptic puncta (red). Scale bars: (C) 100 μm; (NCAM, TuJ1) 20 μm; (Syn) 5 μm.
