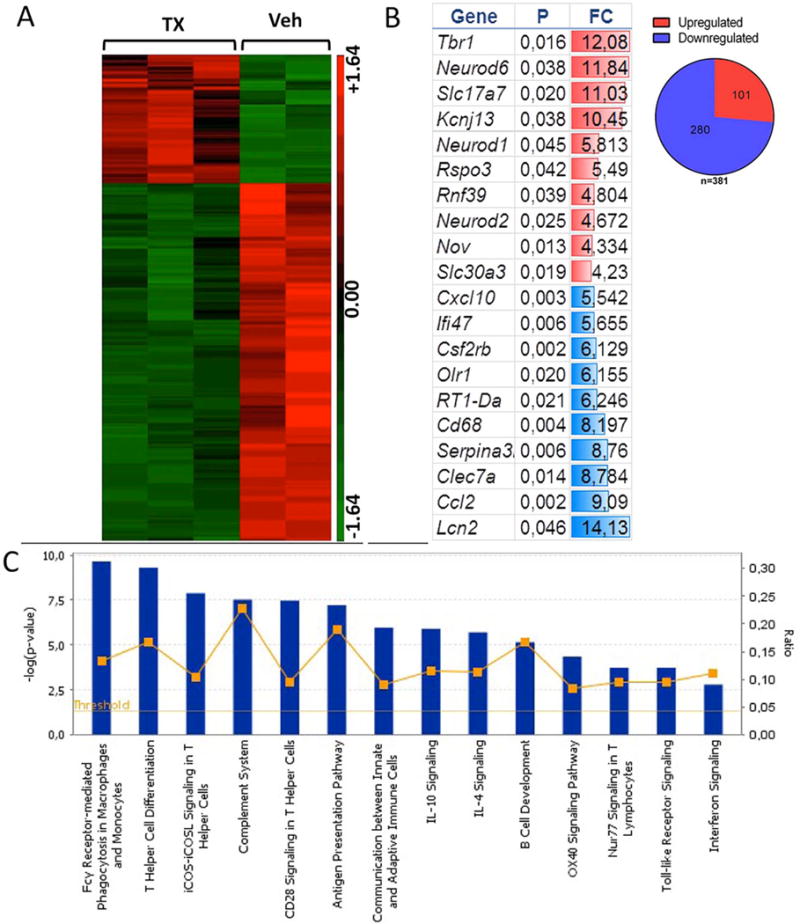
Figure 5.

Gene expression profile analysis of the effect of graft optogenetic stimulation. Striatal tissue was freshly dissected from the graft (n = 3) or vehicle (n = 2) stimulated region and processed for RNA isolation and microarray analysis using the rat Affymetrix gene expression 1.0 ST Array. (A) Heat map of significant genes using ANOVA: red = relative increase in mRNA; green = relative decrease in mRNA expression. (B) Gene ontology analysis shows highest up- and downregulated genes, (p = p value, FC = fold change). The data show upregulation of transcripts involved in neurotransmission, neuronal differentiation, regeneration, axonal guidance, and synaptic plasticity (see Results). (C) Canonical pathways enriched among the significant genes. The blue bars correspond to the log p value, while the yellow line corresponds to the ratio between the number of focus genes in a pathway divided by the total number of genes that make up that pathway. The significance is based on Fischer’s exact test in ingenuity pathway analysis. The data show downregulation of genes involved in the inflammatory response (see Results).
