
Figure 2.
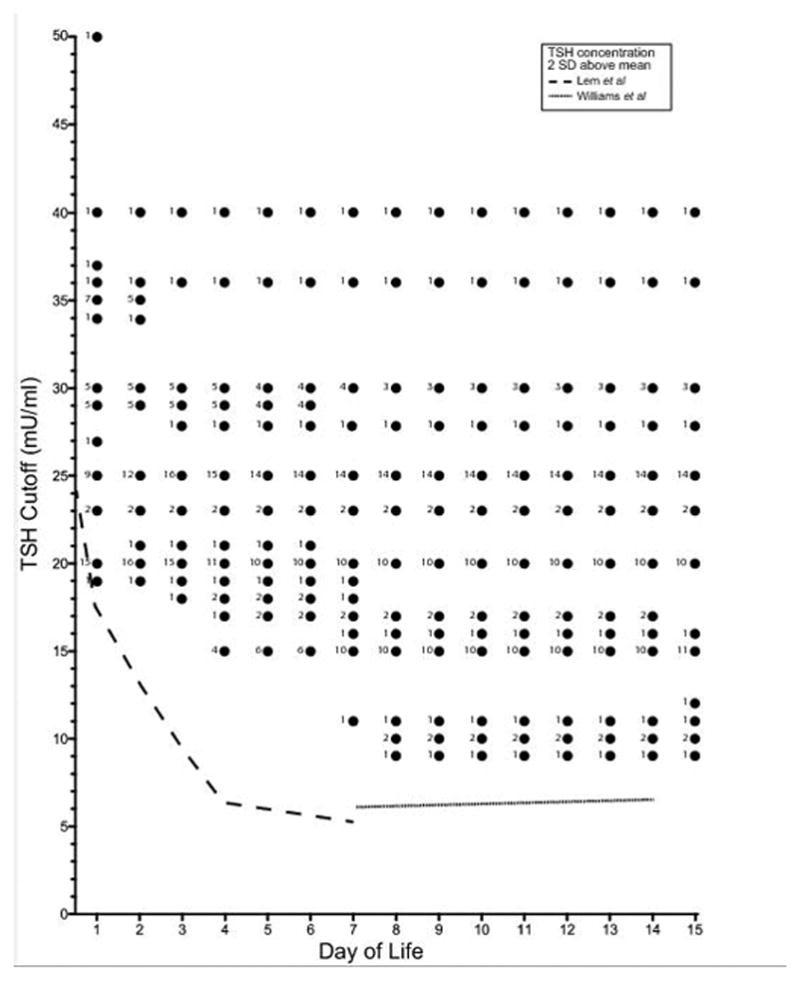
The cutoff serum TSH concentration on NBS that is categorized as abnormal by infant age in days. Each dot represents the upper limit of normal TSH concentrations at the infant’s day of life, and the number designates the number of programs that use this cutoff. Data were not available for one of the 51 programs in the USA, and this program is not represented. Reference TSH values are reported up until the age that each particular program accepts NBS/repeat TSH. The dashed line represents the two standard deviations above the mean TSH concentration for term infants at each day of life (Adapted from Lem et al19 and Williams et al20).