
Figure 1.
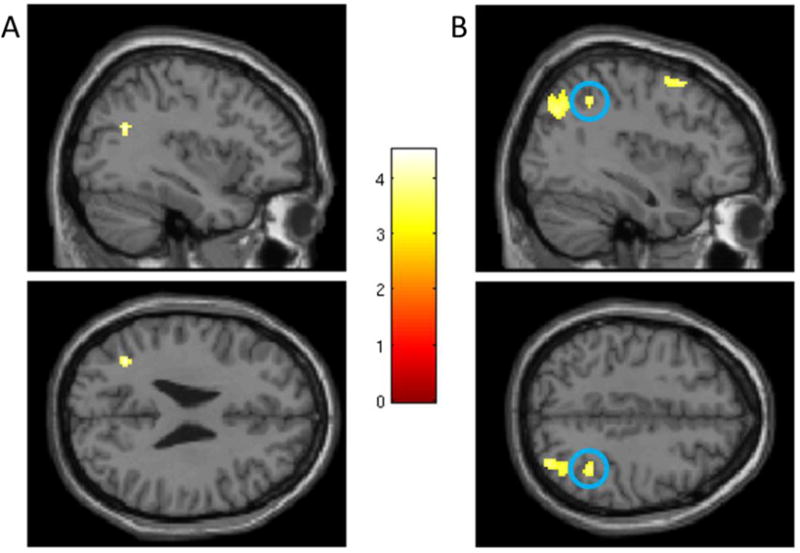
(A) Left angular gyrus activation (centered at x = −36, y = −60, z = 26; top: sagittal view, bottom: axial view) during POS condition. (B) Right inferior parietal cortex activation (circled; centered at x = 38, y = −48, z = 44) during NEG condition. The color bar represents t-values. Coordinates are in MNI space.