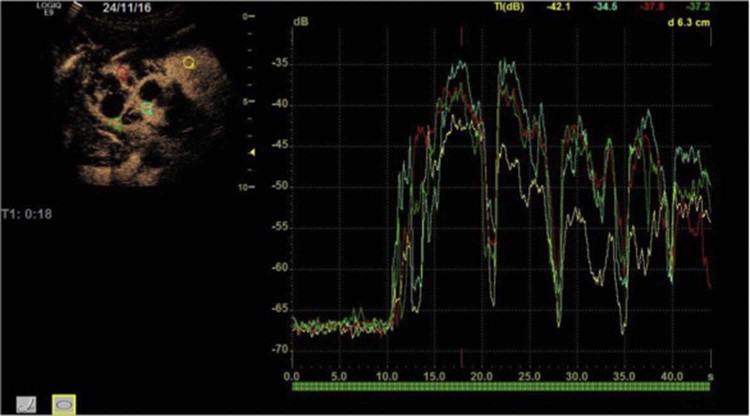
Fig. 6.
Time-intensity curve analysis. Four regions of interest of the same size (4 mm) have been placed, one on the normal renal parenchyma (yellow) and the other three (red, green, and blue) on the parenchyma between the cysts in the upper pole. All four curves have a very similar appearance, particularly the time to peak. We postulate that this is due to the renal parenchyma between the cysts made of normal tissue rather than malignant tissue, which one might expect in renal cell cancer.

