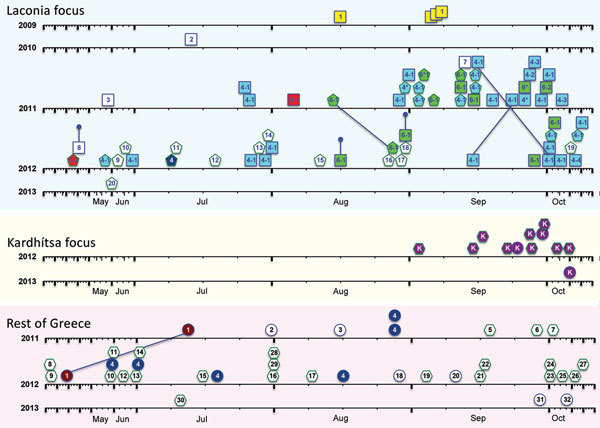
Figure 3.

Temporal representation of the occurrence of Plasmodium vivax haplotypes, Greece, 2009–2013. Data for each region (Laconia, Kardhítsa, and rest of Greece) are depicted. Samples are indicated by shapes: in Laconia, squares indicate Greece residents and pentagons migrants; in Kardhítsa and rest of Greece, circles indicate Greece residents and hexagons migrants. Colors indicate haplotype families: La-1, yellow; La-4, blue; La-5, red; La-6, green; Gr-1, maroon; Gr-4, dark blue; and Ka, purple. Haplotype numbers are given inside shapes. The x-axis time scale for each year was stretched to accommodate the higher number of cases reported during the transmission season, with January, February, March, April, November, and December compressed. Lines joining 2 samples indicate isolates collected from the same person. Truncated vertical lines indicate the 3 samples collected in 2012 from persons considered exposed in the previous year: 1 relapse of a 2011 case and 2 patients with symptom onset in 2012 whose exposure was attributed to the 2011 transmission period. Dates of symptom onset of 2 patients tested in 2012 (green hexagons, haplotypes 28 and 29) were unknown and were arbitrarily assigned date August 1. Further details of samples are provided in online Technical Appendix 1 Tables 1–3 (https://wwwnc.cdc.gov/EID/article/24/3/17-0605-Techapp1.xlsx).
