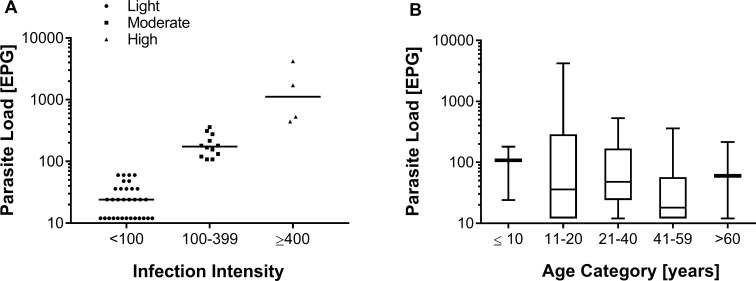
Fig 2. Classification of Schistosoma mansoni-infected individuals according to their parasitic load.
A: Individual egg counts of one fecal sample analyzed with two Kato-Katz slides and classification of egg-positive individuals according to their parasite load. Infection intensity was determined by the number of eggs per gram of feces (EPG) and was classified as light (1–99 EPG, triangles), moderate (100–399 EPG, squares) or heavy (≥400 EPG, circles). Individual EPG values are plotted on a logarithmic scale and the horizontal bars indicate the mean EPG value in each category. B: Boxplots showing the median, interquartile ranges, and 95% intervals of the parasite load (EPG) by the different age groups and indicated on a logarithmic scale. Non-parametric Kruskal-Wallis test revealed no statistical significance between age groups (p > 0.05).

