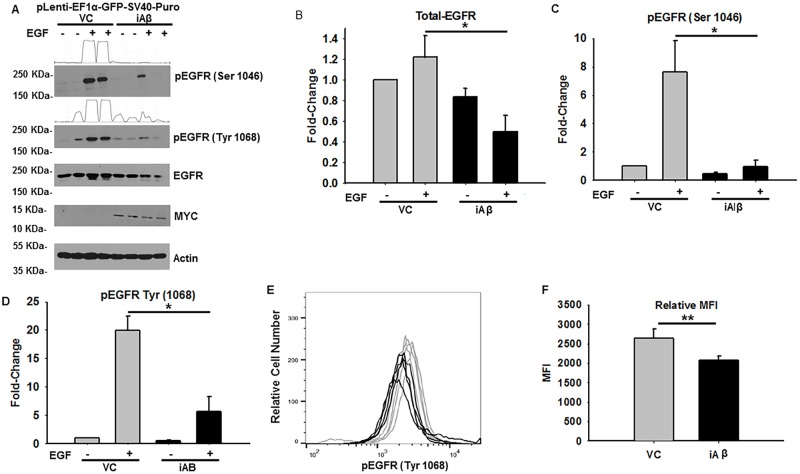
Fig 2. iAβ expression leads to relative reduction in total-EGFR and phospho-EGFR abundance following EGF stimulation.
(A) Immunoblot of phospho-EGFR (Ser 1046 & 1068), total-EGFR, and MYC-Tag in VC or iAβ transduced HEK293 cells following EGF stimulation. MYC-Tagged protein expression is seen in lanes corresponding to iAβ transduced cells only. Reduction in total-EGFR and phospho-EGFR intensities are apparent in EGF treated iAβ cells relative to VC. Two-dimensional gel transformation of phospho-EGFR intensities performed and shown as histogram. Beta-actin used as loading control. (B) Plot of the relative densitometry analysis of total-EGFR expression demonstrates a statistically significant (*p < 0.05) decrease in EGFR abundance in iAβ expressing cells upon EGF stimulation. (C & D) Analysis of phospho-EGFR (Ser 1046 and Tyr 1068) depicts the statistically significant (*p < 0.05) reduction in phospho-EGFR intensities in EGF treated iAβ cells relative to VC. Experiment performed in biological replicates with data shown as mean ± SE (n = 3) and statistical significance. (E) Histogram of phospho-flow cytometry analysis of EGF treated VC (gray) or iAβ (black) transduced HEK293 cells. Shift in the MFI of iAβ transduced cells relative to the VC reflects a decrease in the phospho-EGFR (Tyr 1068) abundance. (F) Graphical depiction of replicate analysis shown as mean ± SE (n = 3) of the MFI with a statistically significant (**p < 0.01) 1.26-fold decrease in MFI.

