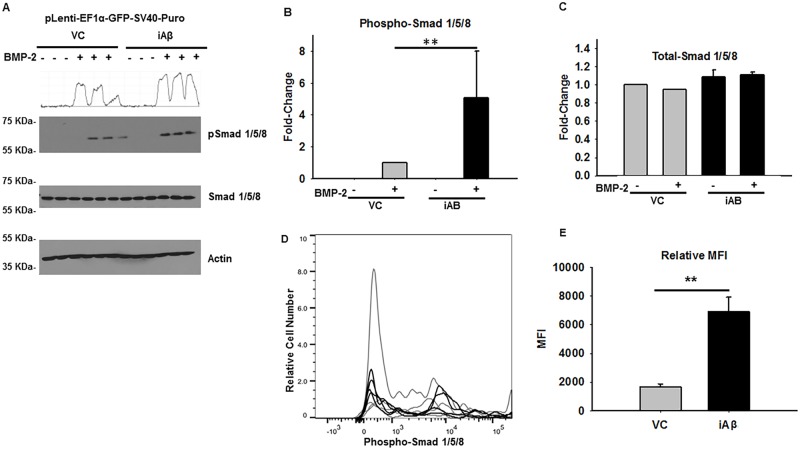
Fig 4. iAβ expression leads to relative increase in BMP-2 dependent Smad 1/5/8 phosphorylation.
(A) Immunoblot of the phospho-Smad 1/5/8 and total-Smad 1/5/8 in VC or iAβ transduced HEK293 cells following rh-BMP2 stimulation. While total-Smad 1/5/8 levels remain unchanged, an increase in the rh-BMP2 dependent Smad 1/5/8 phosphorylation can be observed in the iAβ transduced cells relative to VC. Two-dimensional gel transformation of phospho-Smad 1/5/8 intensities performed and shown as histogram. Beta-actin used as loading control. (B) Plot of the relative densitometry analysis of phospho-Smad 1/5/8 intensity of biological replicates with data shown as mean ± SE (n = 3) with statistical significance (**p < 0.01). (C) Plot of total-Smad 1/5/8 abundance depicting unaltered levels among all groups. (D) Histogram of phospho-flow cytometry analysis of rh-BMP2 treated VC (gray) or iAβ (black) transduced HEK293 cells. A positive shift in iAβ transduced cells relative to the VC can be seen indicating an increase in the abundance of phospho-Smad 1/5/8. (E) Replicate analysis shown as mean ± SE (n = 3) of the MFI with a statistically significant (**p < 0.01) 4.2-fold increase in MFI. Dixon’s outlier analysis was performed on the replicates and there are no outliers within the dataset that should be excluded (p > 0.05).

