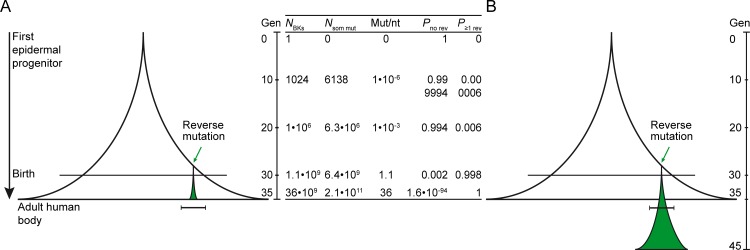
Fig 2. Selective growth advantage may explain the occurrence of clinically recognizable revertant patches.
(A) Schematic representation of the “bell-shaped” increase in cell number according to the n = 2y model starting with a single progenitor. In the later generations, the probability of a reverse mutation approaches 1 asymptotically. However, a reverse mutation that occurs in later generations cannot result in a clinically recognizable patch since the revertant cell cannot go through the required number of mitoses. (B) We therefore propose that revertant cells have a selective growth advantage, e.g. they possess the ability to go through more generations than their mutant neighbors. This would allow reverse mutations to occur at later stages and still result in visible patches. Green area: revertant area. Horizontal bar: size of minimal clinically recognizable patch (≥ 1 cm2). Gen, generation of cells. NBKs, number of basal keratinocytes. Nsom mut, expected total number of new somatic mutations. Mut/Nt, average number of mutations per nucleotide. Pno rev, probability of no reverse mutation. P≥1 rev, probability of at least one reverse mutation.

