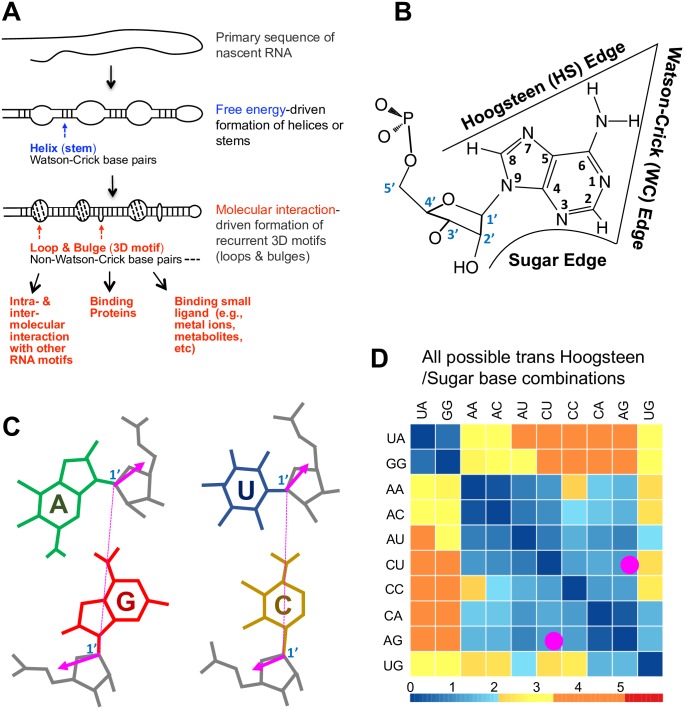
Fig 1. RNA structure basis.
(A) Simple illustration of RNA primary, 2D, and 3D structures. (B) Three edges of adenine nucleotides. (C) Isosteric AG tHS and CU tHS base pairs. Glycosidic bond orientations are highlighted with magenta arrows. C1’-C1’ distances are highlighted with dashed magenta lines. (D) tHS IsoDiscrepancy Index heat map from the RNA Basepair Catalog. Any base combinations in the tHS family are listed, and AG vs CU is marked in magenta dot. Lower numeric value (less than 2.2 in blue color) dictates isosteric base pairs. Values between 2.2 and 3.5, colored in yellow, show nearly isosteric base pairs. Values above 3.5, colored in orange or red, dictate the nonisosteric base pairs. A, adenine nucleotides; C, cytocine nucleotides; G, guanine nucleotides; tHS, Trans Hoogsteen/Sugar edge; U, uridine nucleotides.

