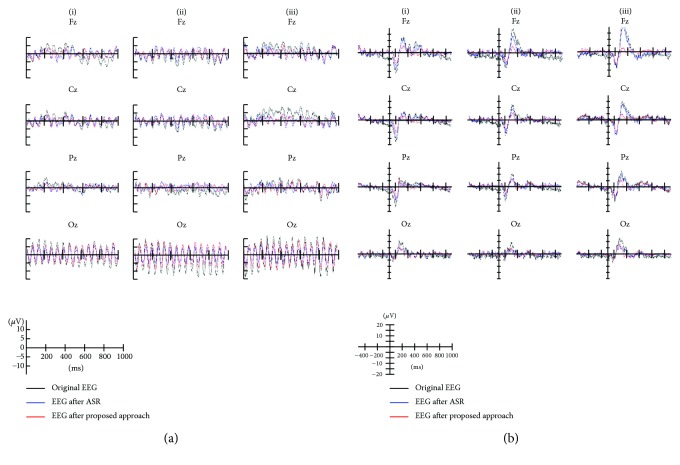
Figure 9.
Averaged evoked potentials in Fz, Cz, Pz, and Oz channels during (a) SSVEP and (b) VEP tasks from a representative subject. Each subplot figure shows the averaged waveforms for three artifacts: (i) blinking artifacts, (ii) head rotation artifacts, and (iii) chewing artifacts. In each panel, black line presents averaged waveform without motion, whereas blue and red lines present averaged waveforms after ASR and after proposed artifact removal method, respectively.

