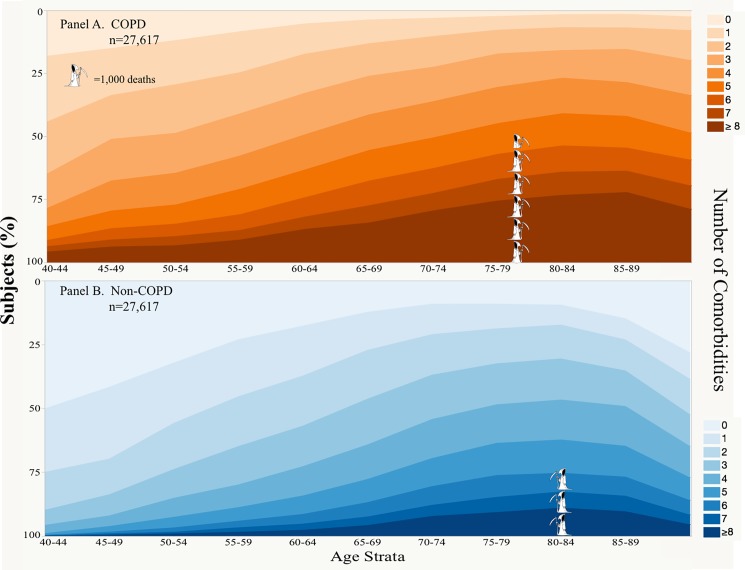
Fig 1. Number of comorbidities per individual by age brackets and total mortality.
Each band represent the number of comorbidities/patient, and the width the proportion of individuals with that number of comorbidities at different age brackets (x-axis). Panel A represent those patients carrying the diagnosis of COPD and Panel B those without COPD. The stacked “Grim Reaper” represents the number of death at 3 years of follow-up (5,247 for COPD and 2,911 in the non-COPD) and their position is located at the mean age of death; one full “Grim Reaper” represents 1,000 deaths.

