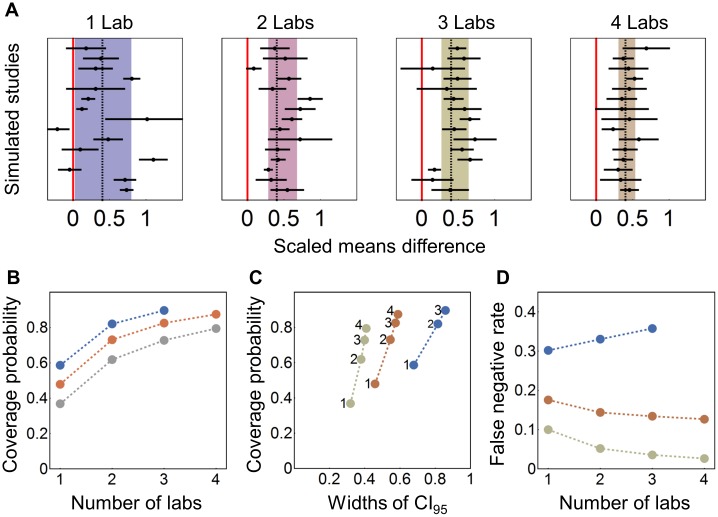
Fig 2. Results of resampling from studies on hypothermia in rodent models of stroke.
(A) Forest plot of 15 randomly selected simulated studies for the 1-, 2-, 3-, and 4-lab scenario and N = 24; dashed line: estimated true effect; shaded area: 95% CI for the effect size estimate based on the sampled studies. The red line indicates a null effect (effect size of 0). (B) pc plotted against the number of participating laboratories for N = 12 (blue), N = 24 (orange), and N = 48 (grey). (C) pc plotted against the average width of the 95% CI. (D) False negative rate plotted against number of laboratories. pc, coverage probability.

