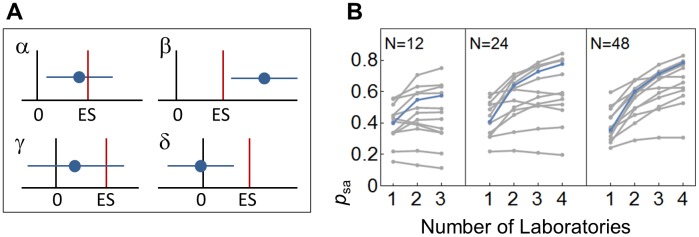
Fig 4. Proportion of studies reporting significant and accurate effects.
(A) Schematic of study outcomes. A study reporting both ES estimates and inferential significant statements can lead to 1 of 4 outcomes. (α) The reported CI for the ES estimate (horizontal blue line) includes the true ES, and the CI is not including 0, suggesting the existence of an effect; (β) the CI covers neither 0 nor the true ES, suggesting the existence of an effect, though its magnitude is either over- or underestimated; (γ) the CI covers the true effect but also 0—in this case “no significant” effect would be reported, and the ES estimate would be ignored or treated as nonrelevant (which is often the case in underpowered studies); (δ) the CI includes 0 but not the true ES, leading again to a “nonsignificant” result. Based on this, we can calculate the ratio of studies accurately estimating the true ES as psa = α / (α + β + γ + δ). (B) psa based on 105 simulated samples for the hypothermia treatment of stroke (blue) and 12 further interventions (grey) for total sample sizes of N = 12, 24, and 48 subjects and k = 1–4 laboratories. ES, effect size.

