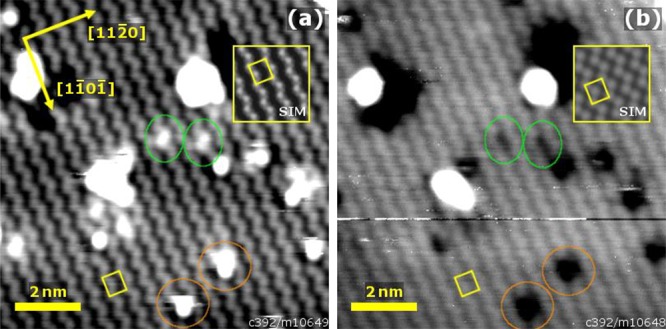
Figure 6.

STM images of the α-Fe2O3(11̅02)-(1 × 1) surface imaging: (a) filled states (10 × 10 nm2, Usample = −3 V, Itunnel = 0.1 nA) and (b) empty states (10 × 10 nm2, Usample = +3 V, Itunnel = 0.1 nA). Both images were acquired on the same sample area and exhibit zigzag rows of bright protrusions running in the [11̅01̅] direction. The relative positions of the defects marked in the green and orange circles suggest that a different sublattice is imaged for each bias polarity. STM simulations (inset), based on the DFT+U calculations described in sections 2.2 and 3.5, are in line with this conclusion. Larger-area STM images of both the (1 × 1) and the (2 × 1) surface are shown in Figure S1.
