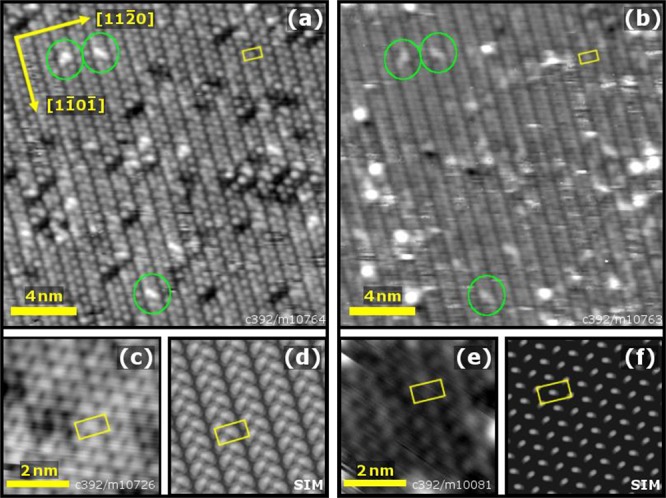
Figure 7.

STM images of the α-Fe2O3(11̅02)-(2 × 1) surface in (a) filled states (20 × 20 nm2, Usample = −2.5 V, Itunnel = 0.1 nA) and (b) empty states (20 × 20 nm2, Usample = +2.5 V, Itunnel = 0.1 nA), recorded over the same sample area. The bright protrusions form zigzag lines, with a pronounced gap between each zigzag. The common position of the defects (marked in green) in the images suggests that the same sublattice is imaged in both filled and empty states. High-resolution images of the (2 × 1) surface are shown in (c) Usample = −1 V, Itunnel = 0.1 nA and (e) Usample = +2 V, Itunnel = 0.1 nA. The (2 × 1) unit mesh is marked by a yellow rectangle. Note that the unit cell contains a protrusion slightly off center of the rectangle. STM simulations based on the “alternating trench” model are shown in (d) for filled states and (f) for empty states.
