
Figure 8.
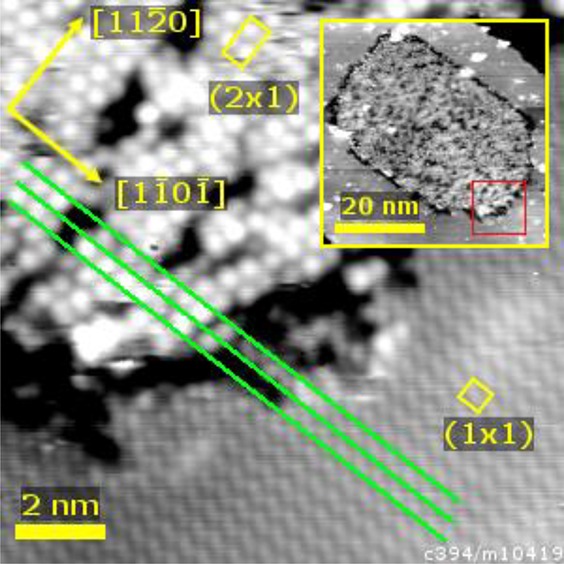
STM image (12.5 × 12.5 nm2, Usample = −2 V, Itunnel = 0.1 nA) of a phase boundary between the (1 × 1) and (2 × 1) surface terminations. The green lines demonstrate that the zigzag rows of surface oxygen atoms imaged in the (1 × 1) phase are continued by a row of larger protrusions in the (2 × 1) termination. The (2 × 1) reconstruction domain has formed on a (1 × 1) terrace, as can be seen in the inset (50 × 50 nm2, Usample = −2.5 V, Itunnel = 0.1 nA). The red box in the inset marks the position of the main image.