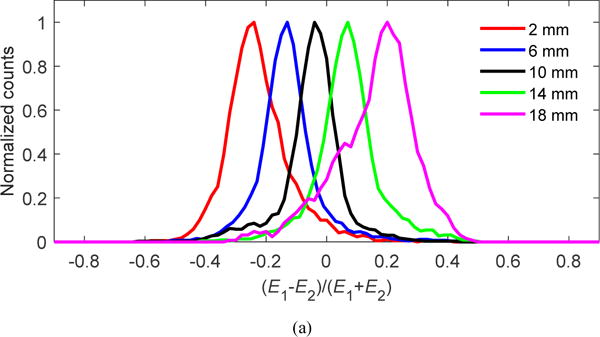
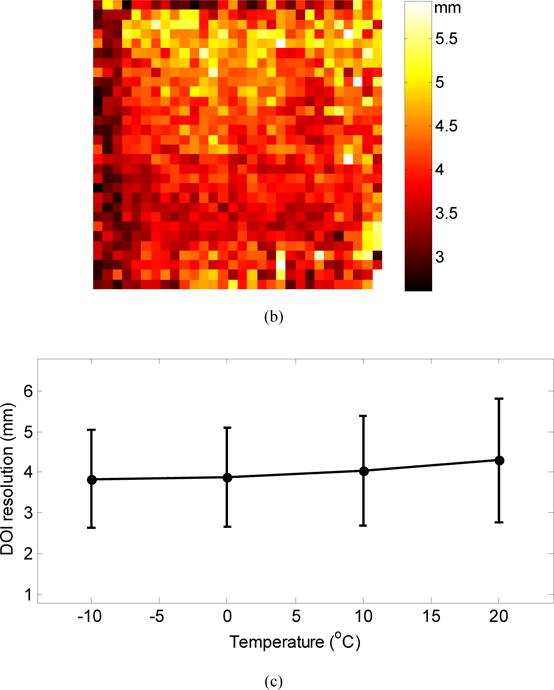
Figure 8.


(a) Histogram of DOI ratio values for a central crystal; (b) DOI resolution (FWHM) for each crystal in the LYSO array obtained at a temperature of −10 °C; (c) average DOI resolution over all crystals and depths versus temperature. The error bars show ± 1σ of the DOI resolution distribution.
