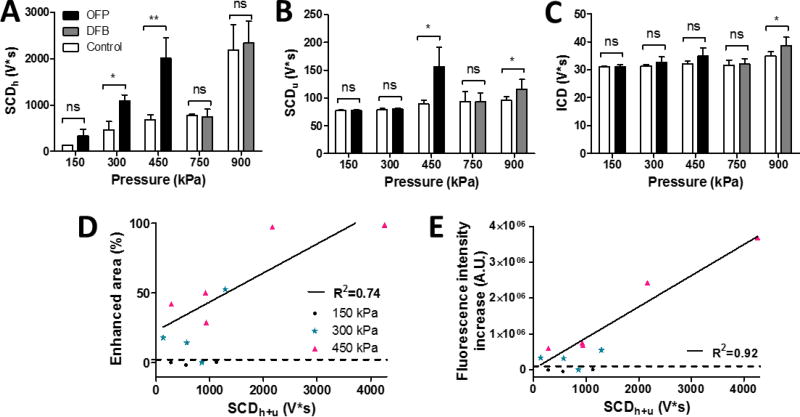
Figure 4.
Cavitation dose of the entire sonication. (A) SCDh or stable cavitation dose with harmonic emissions. (B) SCDu or stable cavitation dose with ultraharmonic emissions. (C) ICD or inertial cavitation dose with broadband emissions. (D) The area of successful delivery and (E) the fluorescence intensity increase using OFP droplets was linearly correlated with the total stable cavitation dose (SCDu+h = SCDh + SCDu) for the cases with successful delivery. The dash line represents the threshold of successful delivery defined by the sham group (mean plus two times of the standard deviation).

