
Fig. 3.
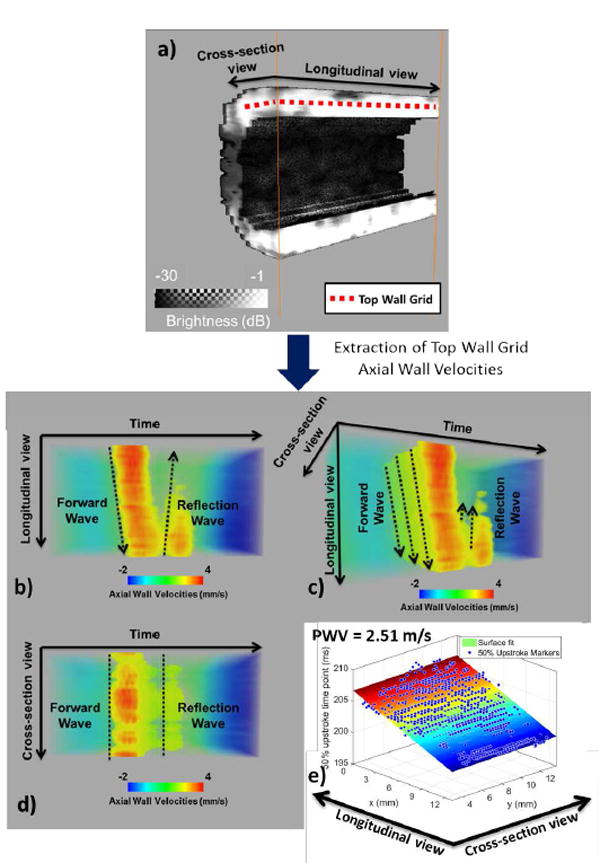
Estimation of PWV in 3-D. a) illustration of the top wall grid overlaid onto the anterior wall cross-sectional and longitudinal section views b), c), d) different views of the 3-D spatio-temporal map e) Estimated 50% upstroke markers and corresponding plane fit. The estimated PWV value is shown in the upper left corner.