
Fig. 8.
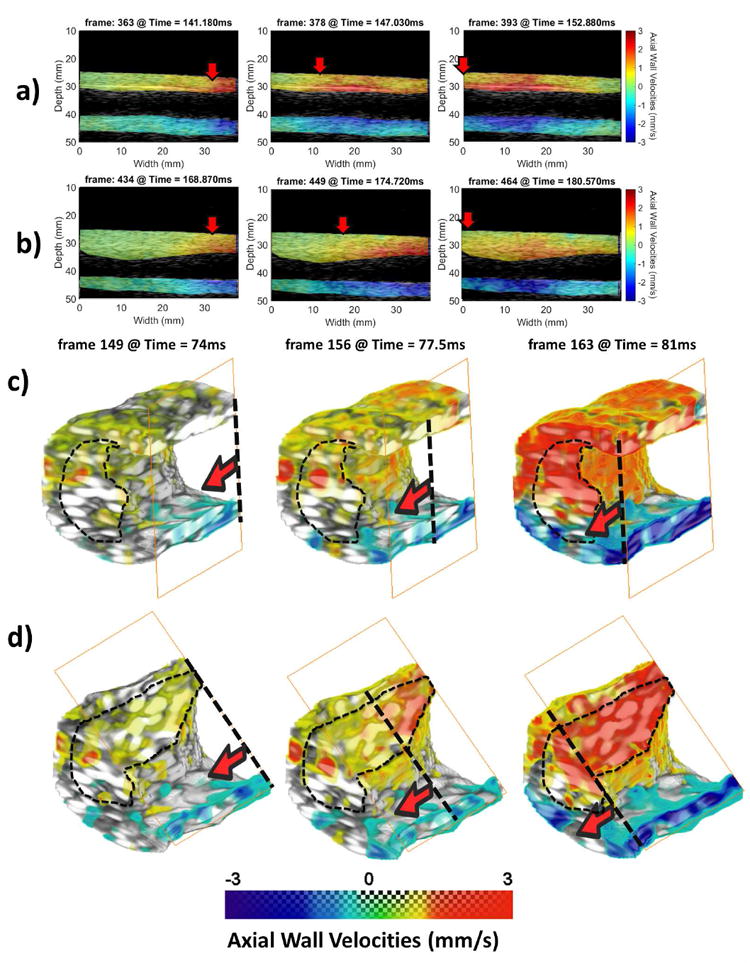
a) Conventional PWI pulse propagation image sequence with the plaque outside of the field of view. b) Conventional PWI pulse propagation image sequence with the plaque within the field of view. c) 4-D PWI pulse propagation image sequence. The phantom wall has been clipped outside of the plaque region to better illustrate pulse wave propagation. d) 4-D PWI pulse propagation image sequence. The phantom wall has been clipped at the plaque region to visualize intra-plaque pulse propagation. The solid red arrows and the transverse perforated lines denote the pulse wavefront and propagation is from right to left side. The extent of the plaque has been delineated with thin black perforated lines