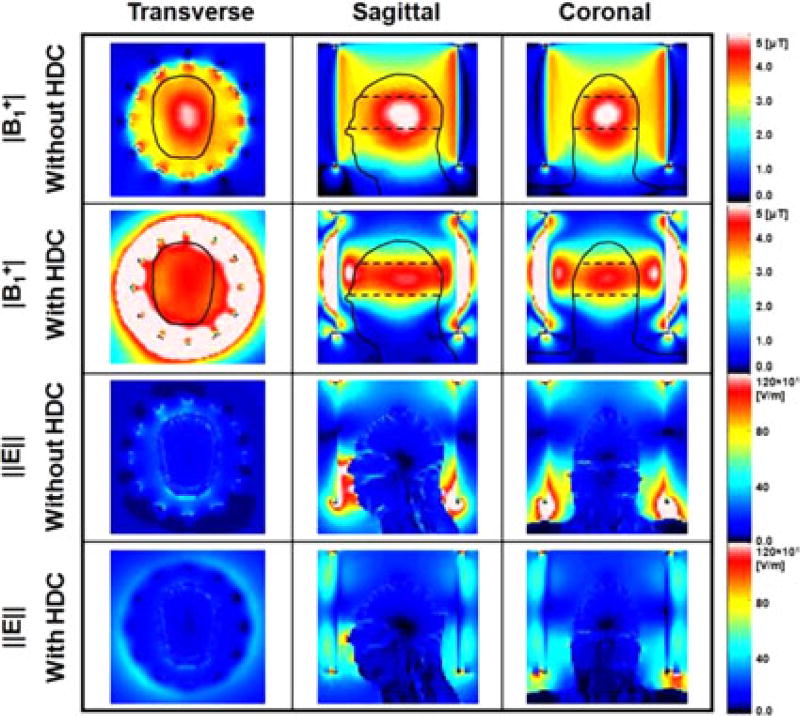
Fig. 2.
Numerical simulation results of |B1+| (first and second row) and ‖E‖ (third and fourth row) calculated with and without a 15-mm-thick sleeve filled with HDC material of BaTiO3. The results on the central transverse (first column), sagittal (second column) and coronal (third column) slices of the head model are shown. The dashed lines in the top two rows represent the ROI used for |B1+| data analysis. Values were normalized to an average |B1+| = 4 µT at the ROI.

