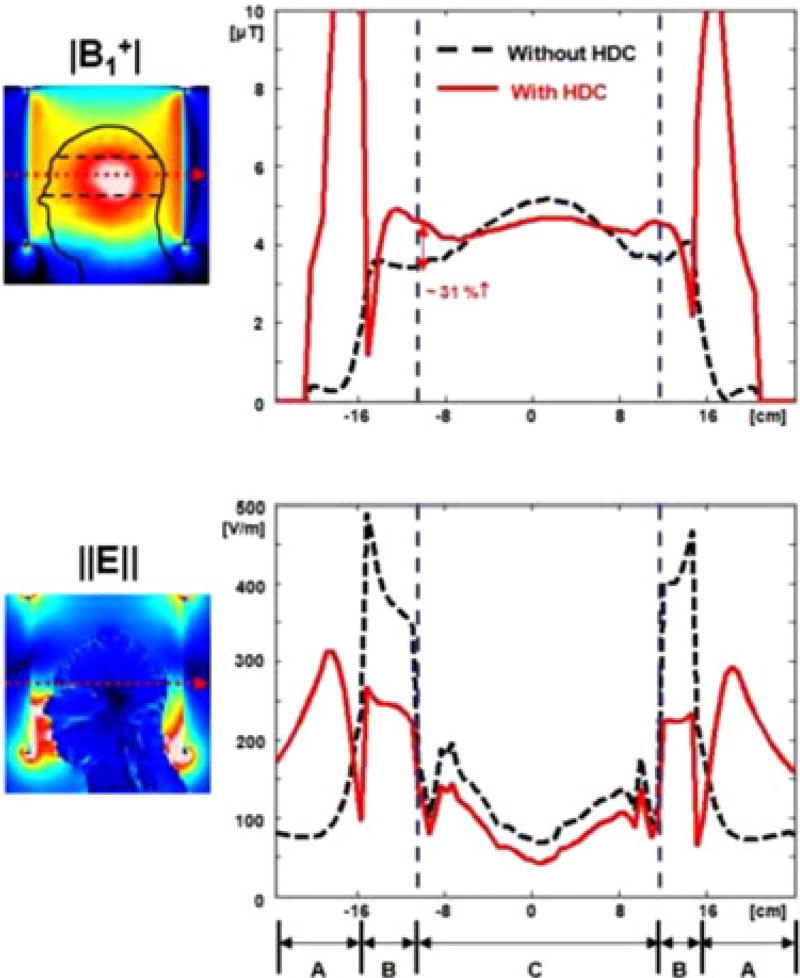
Fig. 3.
Transverse profile of (a) |B1+| and (b) electric field ‖E‖ without (black dashed line) and with (red line) a 15-mm-thick sleeve filled with HDC material of BaTiO3. The red dotted arrows in the sagittal images on the left side indicate the line selected for the graph. The specific regions noted in (b) are: (A) outside of the RF coil, (B) space between RF coil and head, and (C) inside the head. With the addition of the HDC material, there was up to 31% increase of |B1+| at the surface of the head. Values were normalized to an average |B1+| = 4 µT at the ROI.

