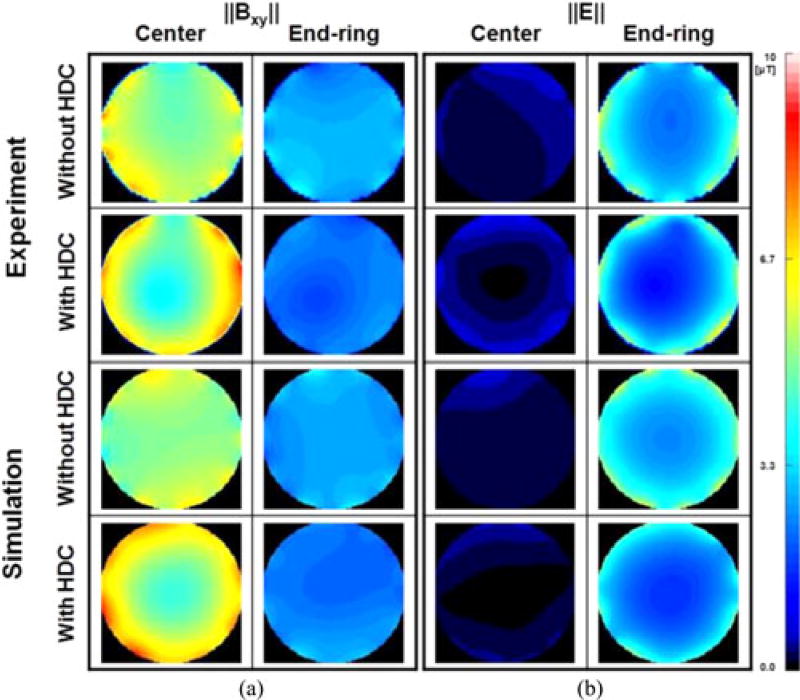
Fig. 8.
Experimentally measured ‖Bxy‖ and ‖E‖ without (first row) and with (second row) a 40-mm sleeve filled with distilled water. Maps show the values in a transverse plane at 1 cm from the center (first and third column) and in a transverse plane near the end-rings (second and fourth column). The third and fourth row show the values calculated with the equivalent simplified numerical model. The FOV was 24 cm wide. Values were normalized to have average ‖Bxy‖ = 4 µT at the ROI of the experiments.

