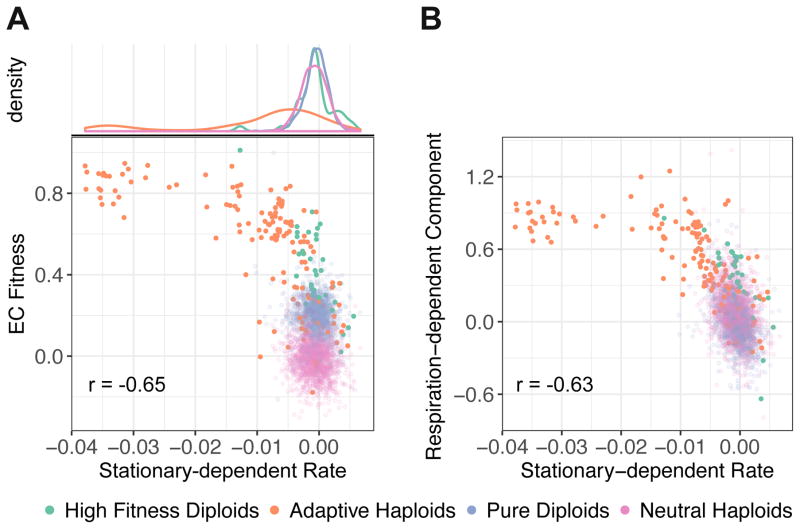
Figure 5. Quantification of stationary-dependent rate.
(A) Fitness change per hour during stationary phase (stationary-dependent rate, inferred from variable cycle length barcode measurements) vs. measured EC fitness.
(B) Stationary-dependent rate vs. respiration-dependent component.
Pearson correlation is calculated for all adaptive lineages in A and B.
See also Figure S2 and S3 and Data S3.

