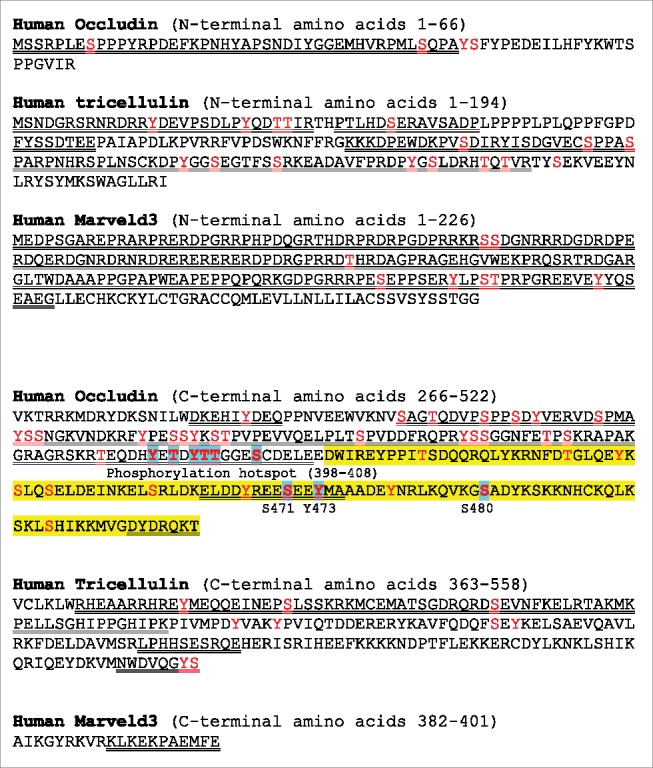
Figure 3.

Ocln, tricellulin and marvelD3 cytoplasmic N- and C-terminal domains. Red text, phosphorylation sites identified by MS14; blue highlighted residues are referred to in text, double underline identified regions predicted to be disordered (see text). Yellow highlighted area in ocln C-terminal domain identifies area with structural information.89,107
