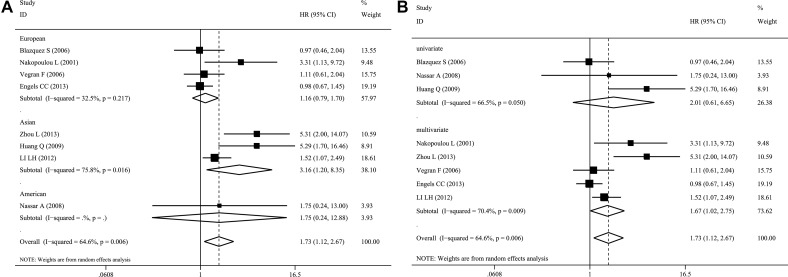
Figure 3. Forest plots of merged analyses of OS and expression of caspase-3 in different subgroups.
(A) Ethnicity subgroup: The results revealed that high caspase-3 expression was significantly associated with poor OS in the Asian subgroup (HR = 3.16, 95%CI 1.20–8.35, P = 0.020), (B) Analytical methods subgroup: The results revealed that caspase-3 was a risk factor for breast cancer patients using multivariate overall survival analysis (HR = 1.67, 95%CI 1.02–2.75, P = 0.044), but no statistical significance was found using univariate subgroups (HR = 2.01, 95%CI 0.61–6.65, P = 0.254).

