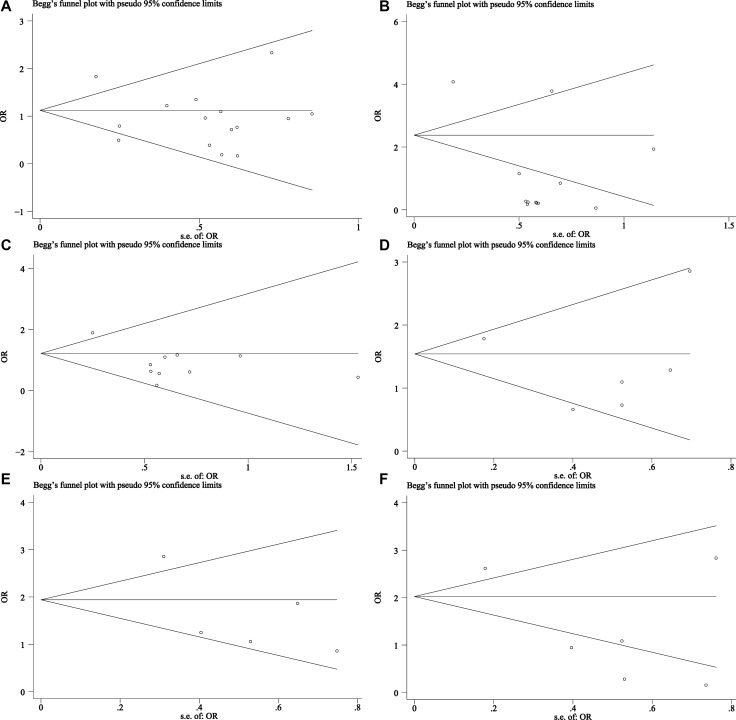
Figure 7. Begg’s funnel plot of publication bias for clinicopathological features.
(A) Lymph nodes metastases (–/+) (random-effects model), (B) Tumor differentiation grade (low, moderate or high differentiated) (random-effects model), (C) Tumor TNM stage (I–II/III-IV) (random-effects model), (D) PR status (–/+) (fixed-effects model), (E) HER-2 status (–/+) (fixed-effects model), (F) ER status (–/+) (random-effects model): The results indicated a slight bias in tumor differentiation grade and ER status with their P values being 0.005, 0.042, respectively.

