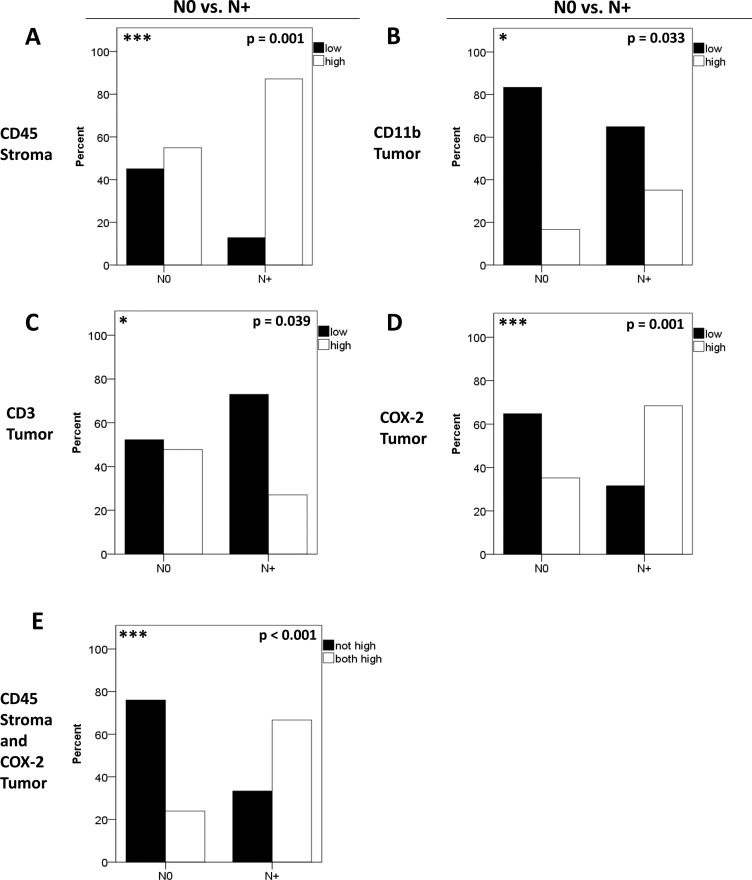
Figure 3. Correlation of biomarkers with nodal metastasis.
Patients were separated according to their N-status in N+ and N0. The distribution of stromal CD45 (A), tumoral CD11b (B), tumoral CD3 (C) and tumoral COX-2 (D) expression is shown for N+ versus N0. Differences in expression patterns between groups were calculated using chi-square-test. Combining high stromal CD45 and tumoral COX-2 expression (E) revealed the most significant association with patients´ N-status (p < 0.001). Patients with simultaneous high stromal CD45 and high tumoral COX-2 expression were labeled “both high”.

