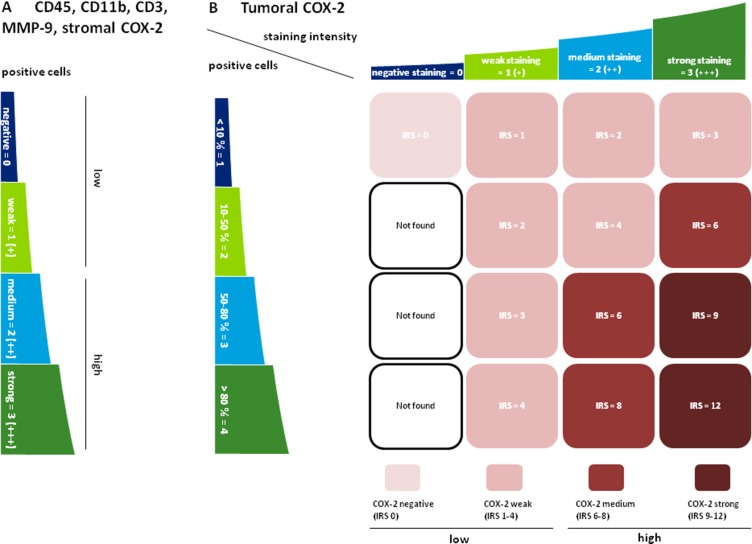
Figure 5. Semiquantitative scoring of CD45 / CD11b / CD3 / MMP-9 and COX-2.
(A) The infiltration of tumoral and stromal regions with CD45, CD11b, CD3 and MMP-9 positive cells as well as the infiltration of stroma with COX-2 positive cells was labeled negative (0), weak (+), medium (++) or strong (+++). Negative and weak scores were categorized as “low” whereas medium and strong staining were subsumed as “high”. For CD3, only patients with a negative scoring were included in the “low” group. This was due to the fact that most patients were in the negative or (+) group and only a very small number of patients (n = 8) presented with a medium (++) or strong (+++) intratumoral score (B) COX-2 was predominantly expressed in the tumor cells and varied in terms of staining intensity. Therefore an immunoreactive score (IRS) for tumoral COX-2 was calculated by multiplication of positive tumor cells with staining intensity. IRS < 6 (0–4) were labeled „low“, IRS ≥ 6 (6-12) indicated “high” expression levels.

