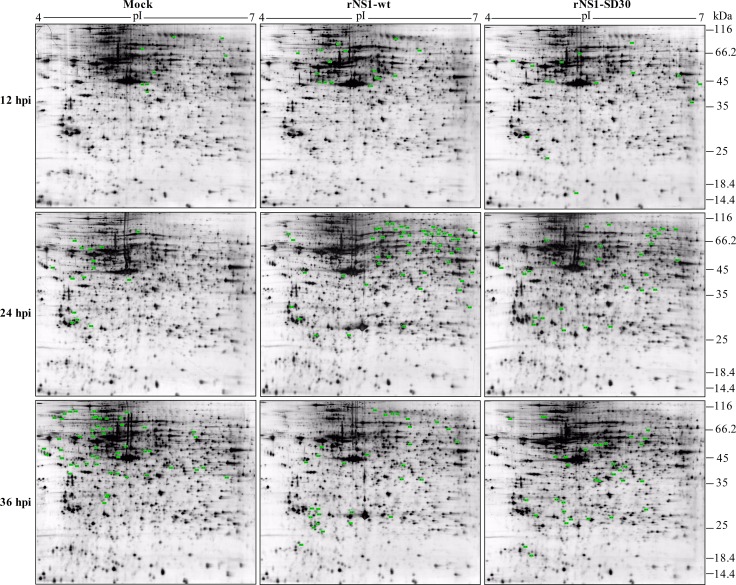
Figure 2. Representative 2-D gel maps of DE protein spots in infected and uninfected CEFs.
The DE proteins detected are marked by green dots. Detailed information is listed in a to g refer to the corresponding footnotes in Table 1, Supplementary Table 3 and 4 with corresponding numbers. The inoculations are indicated at the top and the time points for CEF collection are shown on the left. Representative images generated from samples in each group are shown.

