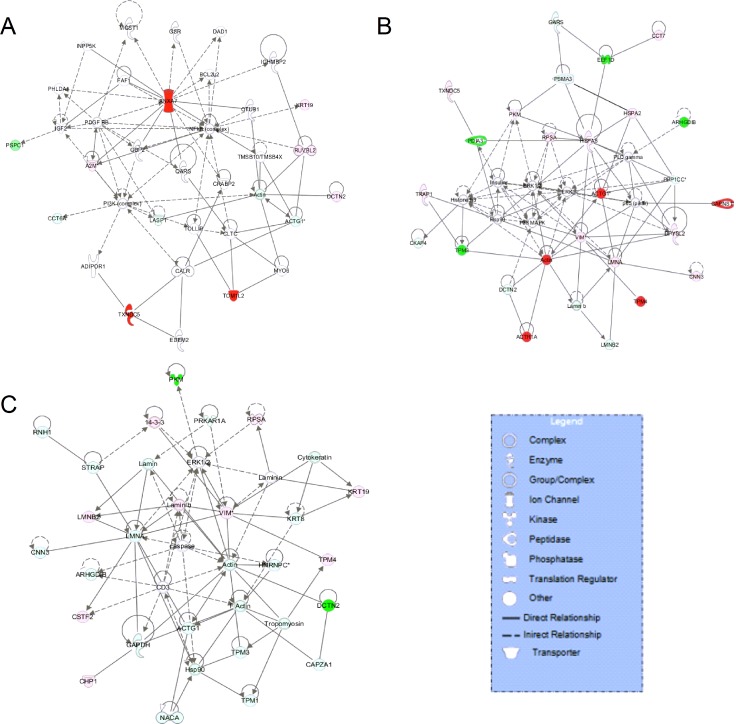
Figure 5. Comparative network pathway analysis DE proteins.
Highest-score network at 12 h (A), 24 h (B) and 36 h (C). Red, upregulated proteins; green, downregulated proteins; white, proteins known to be in the networks but not identified in our study. Color intensities indicates the degree of the change in protein expression levels. The shapes of the symbols are indicative of the molecular class. Lines connecting molecules indicate molecular relationships. Solid lines: direct known interactions; dashed lines: suspected or indirect interactions; arrows: specific molecular relationships and directionality of the interaction.

