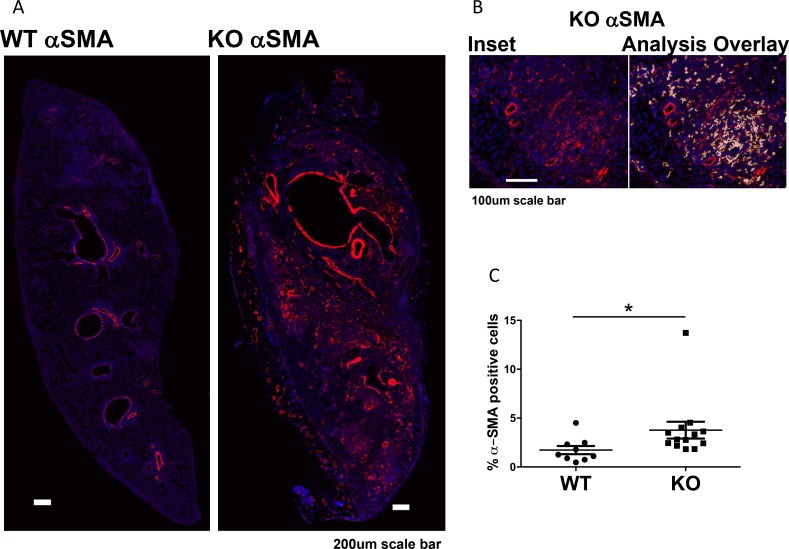
Figure 4. Increased myofibroblasts in lung grafts in KO mice (n = 13) compared to WT (n = 9).
(A) Immunofluorescent staining of α-SMA of lung grafts. Original staining was converted to pseudocolors with computer software. (B) Inset showing an area in the KO lung with a matching image of the marker area overlay (with red, yellow, and white overlays for high, medium, and low intensity staining). Positive staining around the blood vessels and airways was excluded as vascular and airway smooth muscles. (C) Positive staining in the lung parenchyma was quantified and expressed as % of total lung area, showing increased α-SMA staining in KO grafts compared to WT (P = 0.0092). *P < 0.05.

