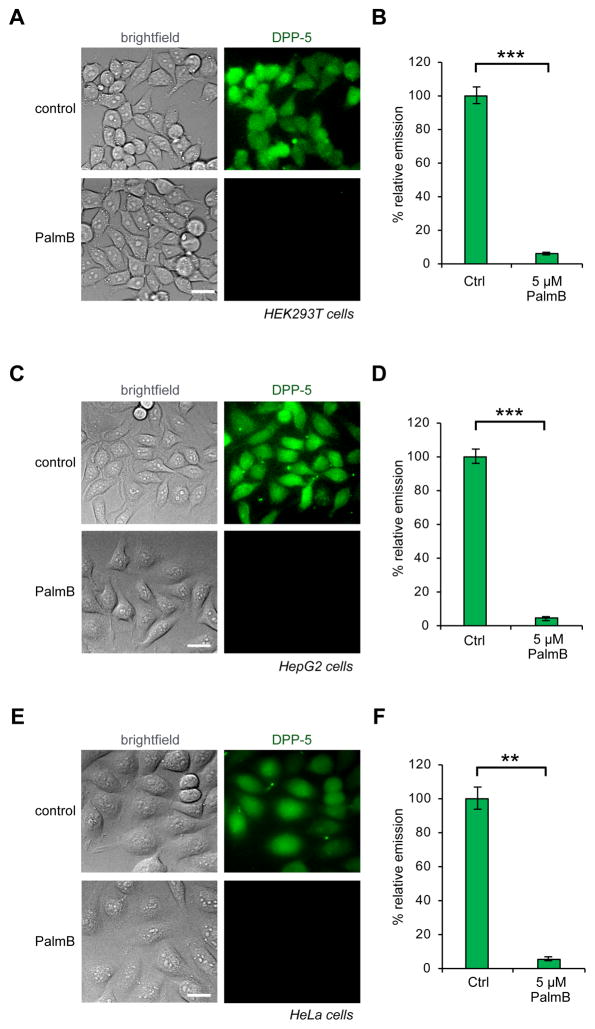
Figure 3.
Activation of DPP-5 by endogenous S-depalmitoylases in live mammalian cells. (A) HEK293T cells treated with either DMSO or 5 μM PalmB for 30 min, washed, loaded with 1 μM DPP-5 with DMSO/5 μM PalmB for 20 min, and imaged by epifluorescence microscopy. (B) Quantification of experiment shown in (A). (C) HepG2 cells treated with either DMSO or 5 μM PalmB for 30 min, washed, loaded with 1 μM DPP-5 with DMSO/5 μM PalmB for 20 min, and imaged by epifluorescence microscopy. (D) Quantification of experiment shown in (C). (E) HeLa cells treated with either DMSO or 5 μM PalmB for 30 min, washed, loaded with 1 μM DPP-5 with DMSO/5 μM PalmB for 20 min, and imaged by epifluorescence microscopy. (F) Quantification of experiment shown in (E). Error bars are s.e.m., n = 3. Statistical analysis performed with a two-tailed Student’s t-test with unequal variance, ** P value < 0.01, *** P value < 0.005. 20 μm scale bars shown.

