
Figure 11.1.
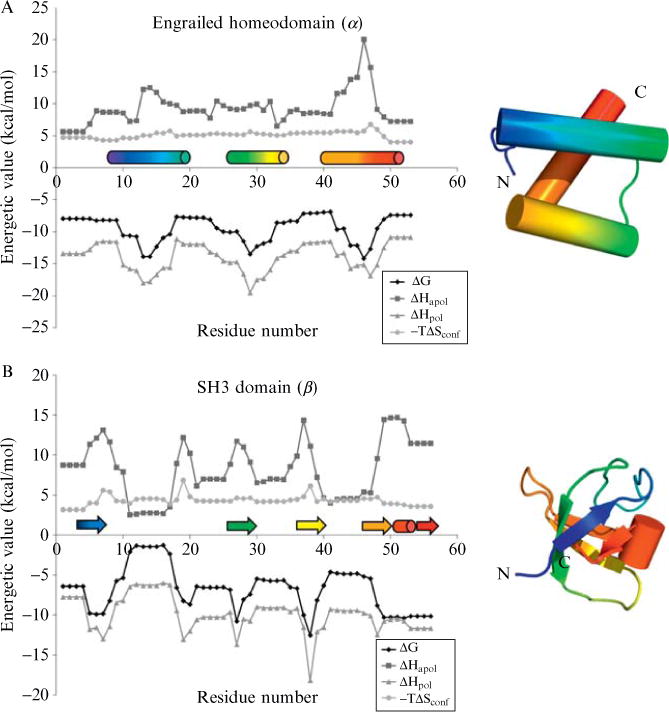
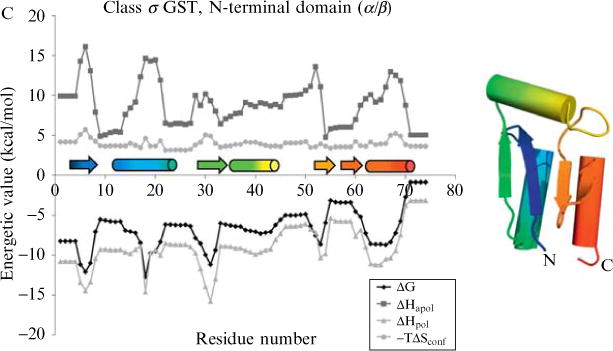
Energetic profiles of three diverse protein structures. These profiles consist of local stability (ΔG), apolar solvation enthalpy (ΔHapol), polar solvation enthalpy (ΔHpol), and conformational entropy (−TΔSconf). The COREX algorithm (window size 5 residues, minimum window-size 4 residues, entropy weighting factor 0.5, simulated pH of 7.0, temperature 25.°C) was run on three proteins: (A) drosophila engrailed homeodomain (PDB code 1p7iA, SCOP sid d1p7ia, SCOP structural class all-alpha, a.4.1.1), (B) mouse SH3 domain (PDB code 1ckaA, SCOP sid d1ckaa1, SCOP structural class all-beta, b.34.2.1), (C) human class sigma glutathione S-transferase, N-terminal domain (PDB code 1iyhA, SCOP sid d1iyha2, SCOP structural class alpha/beta, c.47.1.5). DSSP secondary structure(Kabsch and Sander, 1983) is indicated immediately above the x-axis, helices as cylinders and strands as arrows. Rainbow colors indicate progression from N to C terminus to aid in the reader’s mapping of locations along the primary sequence to locations in the tertiary structure. All energetic values vary as a function of location in the protein structure, a result observed by experiment but not anticipated by treatment of the structure as a rigid entity.