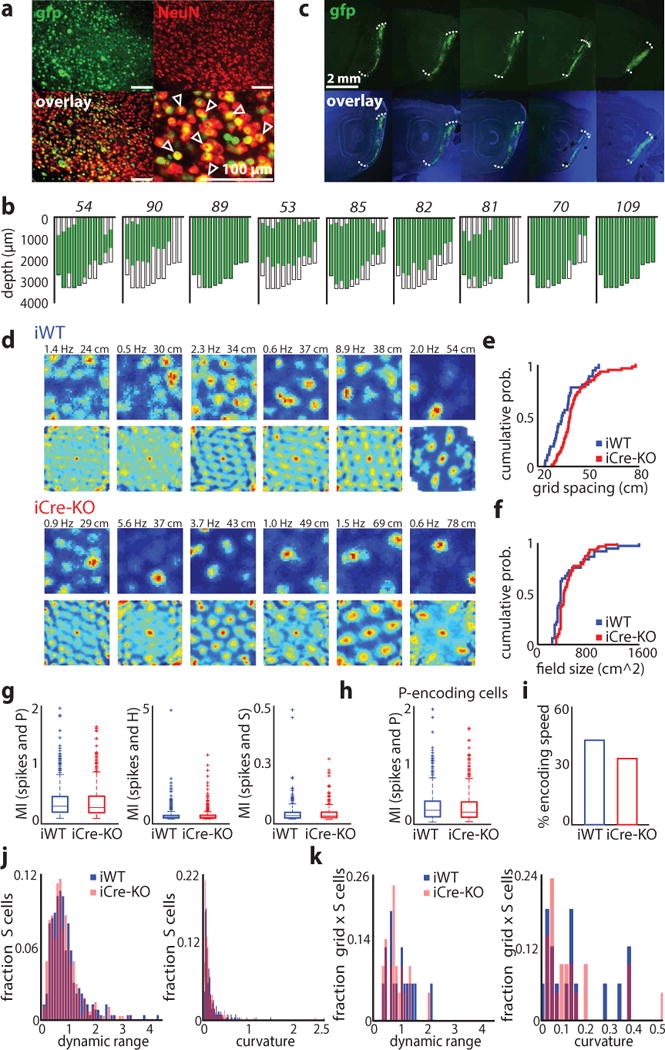
Figure 1.

Knockout of HCN1 in MEC increases grid scale. (a) Virus expression near the injection site. Sections were stained against NeuN (red). The majority of neurons also express the nuclear fusion protein Cre-GFP (green). Scale bars: 100 μm. Arrows indicate virus-infected neurons. The rate of virus infection was determined from brain slices from 6 mice (mean ± SD, 71 ± 18%, n = 24 ROIs from 12 brain slices from 6 mice). (b) Flat maps from nine mice showing the extent of MEC infection; maps are plotted from lateral (left) to medial (right). Mouse identification number in italics. In these mice, virus was present within the majority of MEC (mean ± SD; 60 ± 20% of total volume) and across the medial-lateral and dorsal-ventral axes (medial-lateral: 98 ± 2.4%, dorsal-ventral: 75 ± 17.8%; n = 9 mice). (c) Example of virus expression across the medial-lateral axis of MEC in an individual mouse. Images of dapi and GFP were taken separately and then combined in Photoshop. The intensity of the blue and green channels were adjusted separately to allow for clear visualization of the GFP expression. Similar results were obtained in nine mice randomly selected for virus expression quantification. (d) Examples of grid cells recorded in iWT and iCre-KO mice. Rate maps (top rows) and autocorrelation maps (bottom rows) are color coded for minimum (blue) and maximum (red) values. Peak firing rates (left) and grid spacing (right) are marked at the top of each plot. Grid score, firing rates, and stability did not differ significantly between groups (mean ± SD; grid score: iWT = 0.49 ± 0.12, iCre-KO = 0.59 ± 0.25, Z = −0.98, p = 0.33, two-tailed WRS; FR: iWT = 1.11 ± 2.66 Hz, iCre-KO = 1.75 ± 6.43 Hz, Z = 0.054, p = 0.96, two-tailed WRS; Stability controlled for grid scale F(1, 96) = 0.66, p = 0.42, ɳ2 = 0.007, ANCOVA). (e-f) Cumulative distributions of grid spacing (e) and grid field size (f) in iWT (blue) and iCre-KO (red) mice (n = 37 iWT cells, 62 iCre-KO cells). Grid field size was determined from the radius of the circle around the center field of the autocorrelation map. See Table 1 for statistics. (g) Cells identified as significantly encoding P, H or S using the LN model did not differ in mutual information (MI) between iWT and iCre-KO mice (mean ± SD; P cells spatial information iWT = 0.31 ± 0.29, n = 464, iCre-KO = 0.30 ± 0.29, n = 544, Z = 0.77, p = 0.44; H cells angular information iWT = 0.16 ± 0.35, n = 351, iCre-KO = 0.16 ± 0.30, n = 434, Z = −1.57, p = 0.12; S cells speed information iWT = 0.034 ± 0.045, n = 227, iCre-KO = 0.034 ± 0.046, n = 264, Z = 0.50, p = 0.62, two-tailed WRS tests). Boxes show the first and third quartiles, lines show the median. Whiskers indicate the range, except for data falling above the third quartile or below the first quartile by at least 1.5 times the interquartile range (plotted separately by a plus sign). (h) P cells not classified as border or grid cells in iWT and iCre-KO mice did not differ in MI (mean ± SD; iWT = 0.30 ± 0.29, iCre-KO = 0.27 ± 0.27, Z = 1.33, p = 0.18, two-tailed WRS; n = 355 iWT cells, 419 iCre-KO cells), percent of the environment covered by a field, or spatial stability (mean ± SD; % environment covered: iWT = 35.17 ± 32.52%, iCre-KO = 38.02 ± 33.53%, Z = −1.04, p = 0.30; stability: iWT = 0.18 ± 0.16, iCre-KO = 0.19 ± 0.16, Z = −0.48, p = 0.63, two-tailed WRS tests). Box plots are depicted as in (g). (i) A similar proportion of grid cells in each group significantly encoded speed (16/37 iWT grid cells, 21/62 iCre-KO grid cells; Z = 0.93, p = 0.35, two-tailed binomial test). (j) S encoding cells in iWT and iCre-KO mice did not differ in their speed modulation (defined as (minimum FR – maximum FR)/mean FR) or curvature (mean ± SD; speed modulation: iWT = 0.90 ± 0.62, iCre-KO = 0.85 ± 0.53, Z = 1.01, p = 0.31; curvature: iWT = 0.15 ± 0.25, iCre-KO = 0.13 ± 0.20, Z = 0.95, p = 0.34, two-tailed WRS tests; n = 227 iWT cells, 264 iCre-KO cells). (k) iWT and iCre-KO grid cells that also significantly encoded S did not differ in their speed modulation or curvature (mean ± SD; speed modulation: iWT = 0.93 ± 0.49, iCre-KO = 0.79 ± 0.39, Z = 0.78, p = 0.43; curvature: iWT = 0.13 ± 0.13, iCre-KO = 0.12 ± 0.13, Z = 0.17, p = 0.87, two-tailed WRS tests; n = 16 iWT cells, 21 iCre-KO cells).
