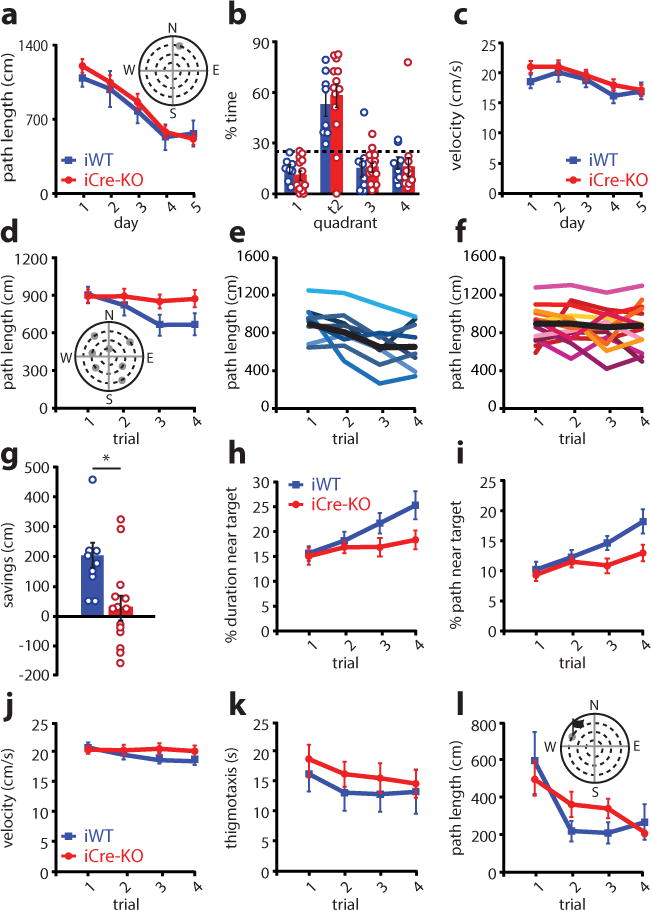
Figure 6.

Rapid place learning is impaired with the loss of MEC HCN1 channels. (a) Distance traveled during the pre-training MWM task was not significantly different between iWT (blue; n = 8) and iCre-KO (red; n = 13) mice (group×day interaction for distance traveled: F(4,76) = 0.36, p = 0.84, main effect of group: F(1,19) = 0.32, p = 0.58, repeated measures ANOVA). Plot shows mean ± SEM with individual data points overlaid. Inset: schematic of the MWM task. (b) Velocity did not differ between groups (main effect of group: F(1,19) = 0.69, p = 0.42; repeated measures ANOVA; n = 8 iWT, 13 iCre-KO mice). Plot shows mean ± SEM with individual data points overlaid. (c) Both groups spent significantly more time in the target quadrant than the other quadrants in a probe test conducted 24 hours after the last session of the MWM task (mean ± SEM; % time in correct quadrant: iWT = 52.70 ± 6.77, iCre-KO = 57.50 ± 6.76; main effect of quadrant type: F(1,19) = 21.94 p = 1.6e-4; main effect of group: F(1,19) = 1.15, p = 0.30, repeated measures ANOVA with group and quadrant type as factors). The dashed line represents chance. Circles show individual data points (n = 8 iWT, 13 iCre-KO mice). Colored bars represent the means and black bars ± SEM. Additionally, for times when the animal was exploring the correct quadrant, the animals’ average distance from the previous platform location did not significantly differ between groups (mean ± SEM; iWT = 42.7 ± 5.66 cm, iCre-KO = 38.0 ± 4.88 cm, t(19) = 0.61, p = 0.55, two-tailed unpaired t-test). (d) Distance traveled on the DMP task decreased across trials in iWT (blue, n = 8) but not iCre-KO (red; n = 13) mice (group×trial interaction: F(3,57) = 2.87, p = 0.044, repeated measures ANOVA with group and trial as factors). The distance traveled by iWT mice, but not iCre-KO mice, decreased over the four trials (main effect of trial: iWT F(3,21) = 6.70, p = 0.0024; iCre-KO F(3,36) = 0.23, p = 0.87; one way repeated measures ANOVAs). Plot shows mean ± SEM with individual data points overlaid. Inset: schematic of the DMP task. Grey circles mark the potential locations of the platform. (e-f) Distance traveled on the DMP by all iWT (e) and all iCre-KO (f) mice. Each colored line represents one subject. The black line shows the mean. (g) iCre-KO (red; n = 13) mice showed significantly less savings (difference in path length late versus early trials) than iWT (blue; n = 8) mice (mean ± SEM; iWT = 200.80 ± 41.46 cm, iCre-KO = 30.03 ± 40.35 cm, t(19) = 2.80, p = 0.011, two tailed t-test). Circles show individual data points. Colored bars represent the means and black bars ± SEM. *p<0.05. (h-i) The improvement of iWT on later trials was reflected in their search strategy. iWT (blue; n = 8), but not iCre-KO (red, n = 13) mice spent an significantly increasing proportion of their search path in the area surrounding the target platform (% path in target area, group×trial interaction: F(3,57) = 3.16, p = 0.031, repeated measures ANOVA) (h), and a similar trend was observed for duration (% duration in area surrounding, group×trial interaction: F(3,57) = 2.59, p = 0.062, repeated measures ANOVA) (i). Plots show mean ± SEM with individual data points overlaid. (j) The average velocity was not significantly different between groups (mean ± SEM; iWT = 19.62 ± 0.83 cm/s, iCre-KO = 20.60 ± 0.76 cm/s, main effect of group: F(1,19) = 0.71 p = 0.41, repeated measures ANOVA). Plot shows mean ± SEM with individual data points overlaid. (k) Time spent in thigmotaxis was not significantly different between groups (main effect of group: F(1,19) = 0.44, p = 0.51, repeated measures ANOVA). Plot shows mean ± SEM with individual data points overlaid. (l) The distance traveled by iWT and iCre-KO mice was comparable on a cued-version of the DMP, in which a prominent proximal visual cue was erected above the platform (group×trial interaction: F(3,57) = 1.64, p = 0.19, repeated measures ANOVA; n = 8 iWT mice, 13 iCre-KO mice). Plot shows mean ± SEM with individual data points overlaid.
