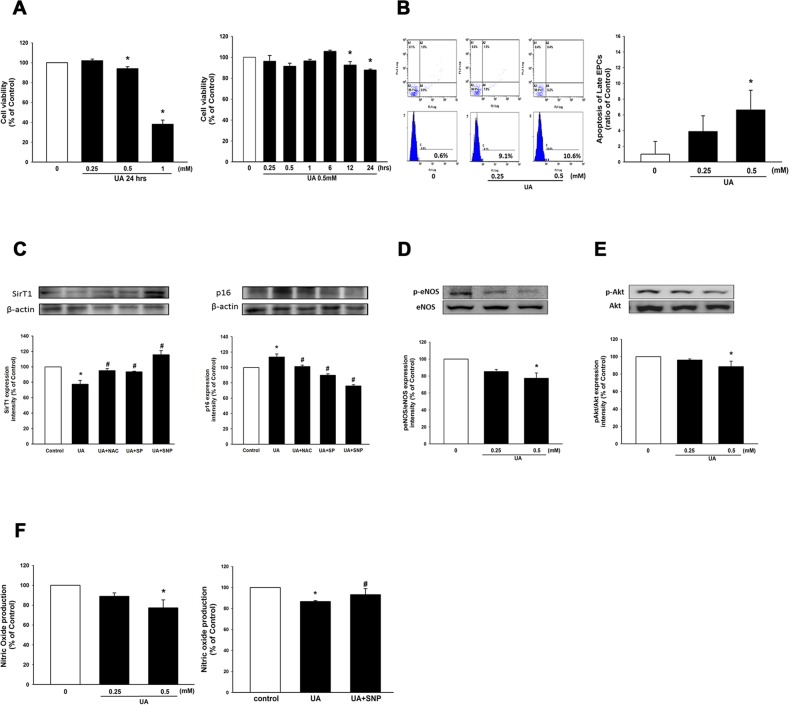
Figure 2. Effects of uric acid on EPC viability, apoptosis, NO production, eNOS and Akt phosphorylation.
(A) EPC viability was analyzed by MTT assay. EPC viability was compared when cultured at different concentrations of uric acid (0, 5, 10, and 20 mg/dL) for 24 hr. and in a high-level uric acid concentration (10 mg/dL) was followed at different time points. (B) EPC apoptosis was detected by annexin V assay using flow cytometry. EPC apoptosis was compared at different uric acid concentrations (0, 5, 10 mg/dL). (C) Expression of sirT1 and p16 protein levels. (D) Expression of phosphorylated eNOS. (E) and phosphorylated Akt protein levels. (F) NO production was assessed by staining with a NO fluorescent indicator (DAF-FM). NO production was assessed in the high-level uric acid by the presence of SNP. SNP: S-nitroso-N-acetyl-D, L-penicillamine, a NO-donor. Data are mean ± SEM; n=4; * P < 0.05 versus control; # P < 0.05 versus high-level uric acid (UA).

