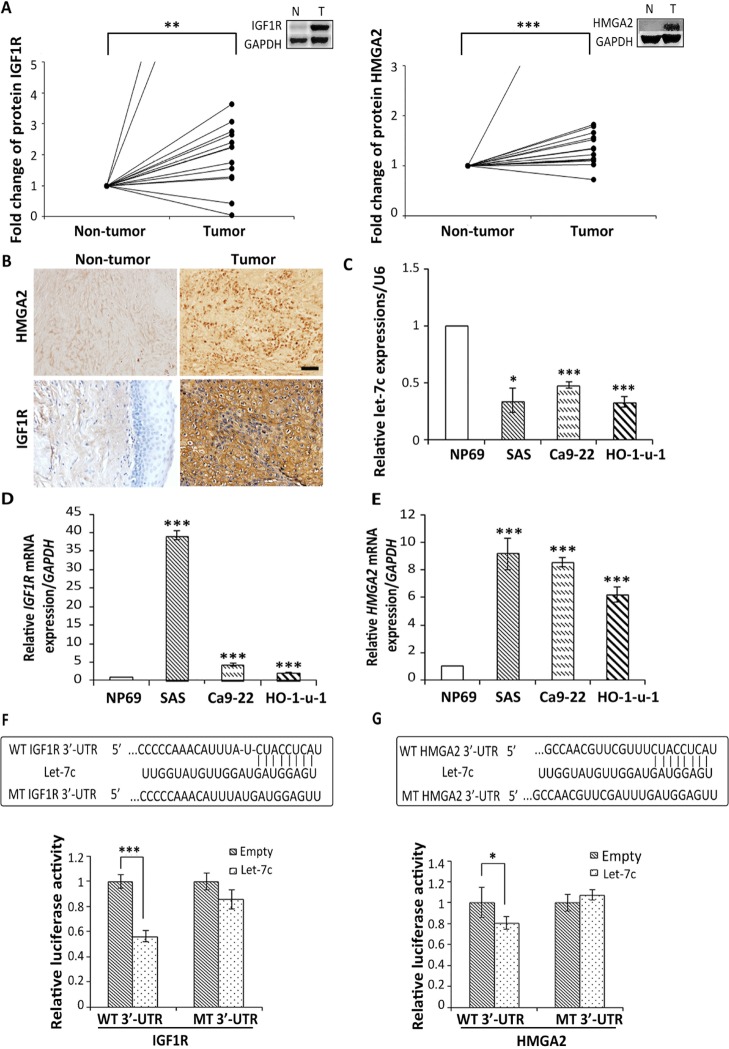
Figure 1. Let-7c directly binds to the 3′-UTRs of IGF1R and HMGA2.
Relative protein levels of (A) IGF1R and HMGA2. IGF1R and HMGA2 in HNSCC tumor tissues and adjacent non-tumor tissues (n = 15) were examined by western blot analysis with GAPDH serving as loading control. Thereafter, the target protein levels were calculated as fold change compared to paired non-tumor levels. Non-tumor levels were set as 1. Statistical analysis was performed using the Student’s paired t-test. (B) Representative IHC staining of IGF1R and HMGA2 in HNSCC tumor tissues and adjacent non-tumor tissues. Original magnification ×100 and ×200; bar represents 50 μm. Expression of (C) Let-7c, (D) IGF1R, and (E) HMGA2 in HNSCC cell lines SAS, Ca9-22, and H0-1-u-1 compared to non-malignant nasopharyngeal epithelial cell line NP69. Let-7c-binding sites in the IGF1R and HMGA2 3′-UTRs were predicted by TargetScan. (F) 2619–2626nt of the IGF1R 3′-UTR sequence and (G) 21–28nt of the HMGA2 3′-UTR sequence, as well as the complementary let-7c binding sequences and the target mutated sequences, are shown in the boxed rectangles. For the luciferase reporter assays, SAS cells were co-transfected with 50 ng of PCMV-MIR vector or PCMV-MIR-let-7c vector and 100 ng dual-luciferase vector containing either wild-type or mutant 3′-UTR of (F) IGF1R and (G) HMGA2. The relative firefly luciferase activity normalized with renilla luciferase was measured 24 h after transfection. Statistical analysis was performed using the Student’s t-test. *P < 0.05; **P < 0.01; ***P < 0.001.

