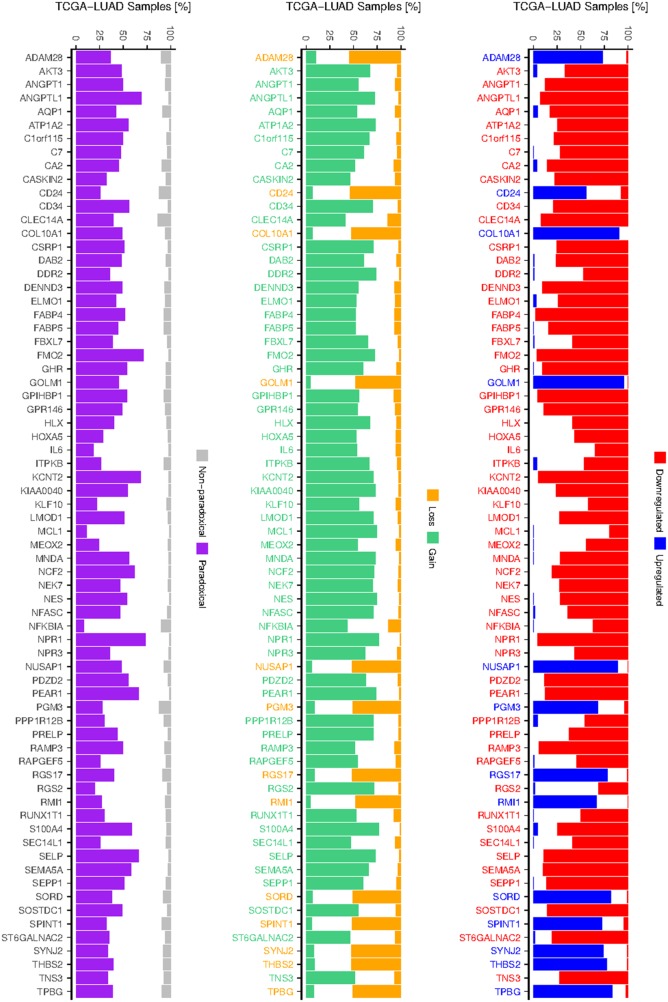
Figure 3. Frequency of deregulation and CNAs of paradoxical genes.
Barplot at the left shows frequencies of paradoxical and non-paradoxical co-occurrence of deregulated expression and CNAs. Barplots depicting frequencies of up- and downregulation (middle), gain and losses (right) of 70 validated paradoxical genes, as occur across TCGA LUAD samples. Colors of the gene labels indicate their deregulation/CNA status as obtained from the integrative analysis.

