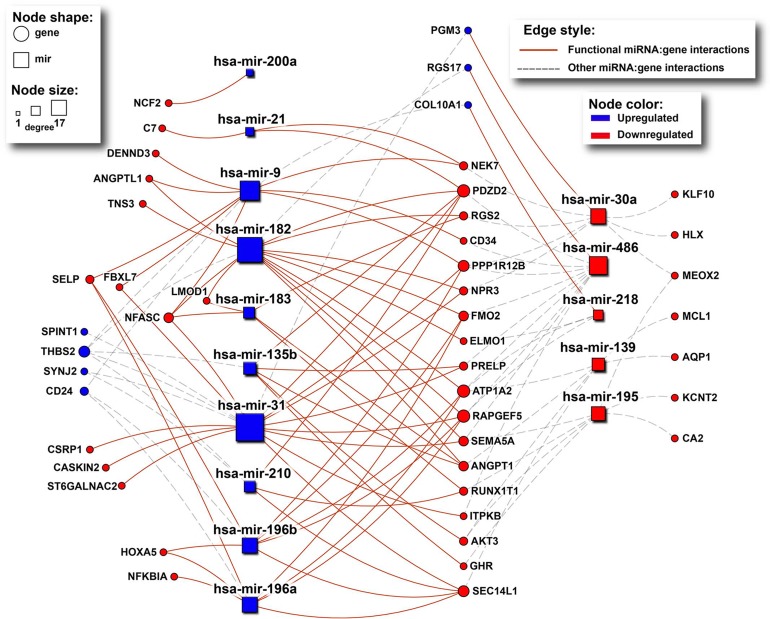
Figure 5. The network of interactions between deregulated miRNAs and their paradoxical gene targets as obtained from mirDIP.
Rectangles and circles represent miRNAs and genes, respectively. Red color denotes downregulated transcripts, while blue denotes upregulated ones. Size of nodes corresponds to number of interactions (degree). Solid red lines indicate miRNA:gene interactions between inversely deregulated transcripts, indicating potential causal associations.

